| Red | Green | Blue | |
| z | 17.64 | ||
| znorm | Inf | ||
| sky | -NaN | -Inf | -Inf |
| S/N | 21.9 | 38.3 | 39.5 |
| S/N(c) | 0.0 | 0.0 | 0.0 |
| SN(E/C) |


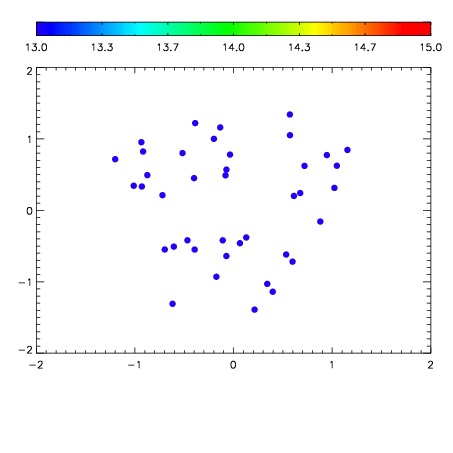

| Frame | Nreads | Zeropoints | Mag plots | Spatial mag deviation | Spatial sky 16325A emission deviations (filled: sky, open: star) | Spatial sky continuum emission | Spatial sky telluric CO2 absorption deviations (filled: H < 10) | |||||||||||||||||||||||
| 0 | 0 |
|
|
|
|
|
|
| IPAIR | NAME | SHIFT | NEWSHIFT | S/N | NAME | SHIFT | NEWSHIFT | S/N |
| 0 | 06090026 | 0.477715 | 0.00000 | 18.9443 | 06090025 | 1.36217e-05 | 0.477701 | 18.8369 |
| 1 | 06090023 | 0.477293 | 0.000421971 | 19.0014 | 06090024 | 0.000876107 | 0.476839 | 18.9676 |
| 2 | 06090022 | 0.477285 | 0.000429988 | 18.9802 | 06090021 | 0.00000 | 0.477715 | 18.9072 |
| 3 | 06090027 | 0.477695 | 1.99974e-05 | 18.9587 | 06090028 | 0.000146395 | 0.477569 | 18.8974 |