| Red | Green | Blue | |
| z | 17.64 | ||
| znorm | Inf | ||
| sky | -Inf | -NaN | -NaN |
| S/N | 21.8 | 39.9 | 40.1 |
| S/N(c) | 0.0 | 0.0 | 0.0 |
| SN(E/C) |
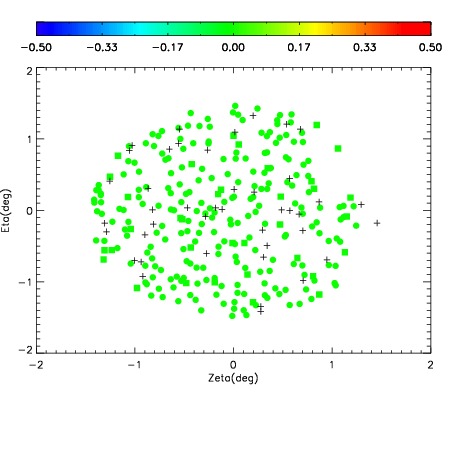
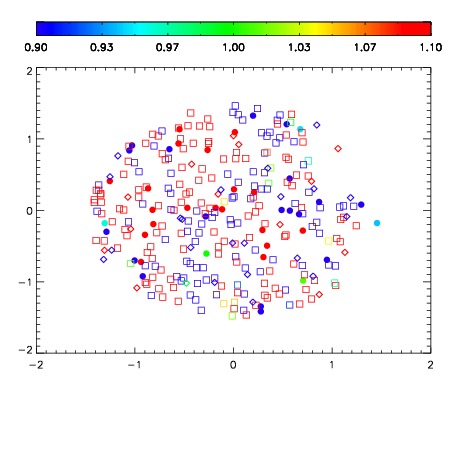


| Frame | Nreads | Zeropoints | Mag plots | Spatial mag deviation | Spatial sky 16325A emission deviations (filled: sky, open: star) | Spatial sky continuum emission | Spatial sky telluric CO2 absorption deviations (filled: H < 10) | |||||||||||||||||||||||
| 0 | 0 |
|
|
|
|
|
|
| IPAIR | NAME | SHIFT | NEWSHIFT | S/N | NAME | SHIFT | NEWSHIFT | S/N |
| 0 | 05450027 | 0.495295 | 0.00000 | 18.6260 | 05450026 | 0.000462902 | 0.494832 | 18.5574 |
| 1 | 05450024 | 0.491958 | 0.00333700 | 18.7528 | 05450025 | 0.00121402 | 0.494081 | 18.7851 |
| 2 | 05450028 | 0.495250 | 4.50015e-05 | 18.6269 | 05450029 | 0.000987686 | 0.494307 | 18.6764 |
| 3 | 05450023 | 0.492011 | 0.00328398 | 18.3412 | 05450022 | 0.00000 | 0.495295 | 18.3032 |