| Red | Green | Blue | |
| z | 17.64 | ||
| znorm | Inf | ||
| sky | -NaN | -NaN | -Inf |
| S/N | 25.4 | 43.7 | 46.1 |
| S/N(c) | 0.0 | 0.0 | 0.0 |
| SN(E/C) |

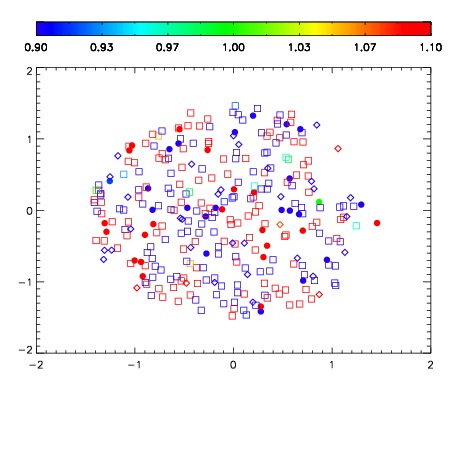
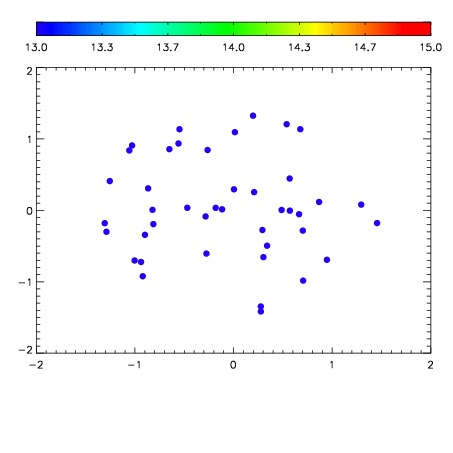

| Frame | Nreads | Zeropoints | Mag plots | Spatial mag deviation | Spatial sky 16325A emission deviations (filled: sky, open: star) | Spatial sky continuum emission | Spatial sky telluric CO2 absorption deviations (filled: H < 10) | |||||||||||||||||||||||
| 0 | 0 |
|
|
|
|
|
|
| IPAIR | NAME | SHIFT | NEWSHIFT | S/N | NAME | SHIFT | NEWSHIFT | S/N |
| 0 | 06320027 | 0.475265 | 0.00000 | 18.3903 | 06320026 | 0.00000 | 0.475265 | 17.9306 |
| 1 | 06320032 | 0.474481 | 0.000784010 | 19.1396 | 06320033 | -0.00468952 | 0.479955 | 19.1540 |
| 2 | 06320031 | 0.473139 | 0.00212601 | 19.1167 | 06320030 | -0.00377538 | 0.479040 | 19.0181 |
| 3 | 06320028 | 0.475019 | 0.000245988 | 19.0972 | 06320029 | 0.00660872 | 0.468656 | 18.7210 |