| Red | Green | Blue | |
| z | 17.64 | ||
| znorm | Inf | ||
| sky | -Inf | -Inf | -Inf |
| S/N | 31.2 | 52.2 | 54.7 |
| S/N(c) | 0.0 | 0.0 | 0.0 |
| SN(E/C) |


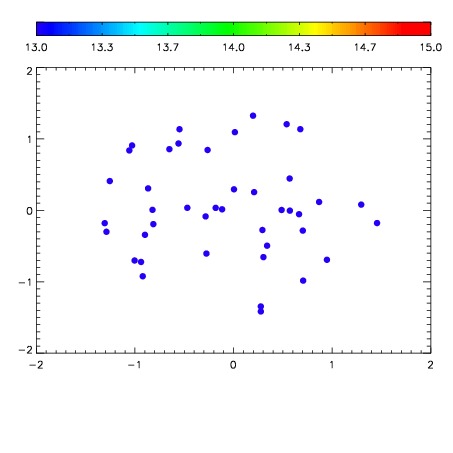

| Frame | Nreads | Zeropoints | Mag plots | Spatial mag deviation | Spatial sky 16325A emission deviations (filled: sky, open: star) | Spatial sky continuum emission | Spatial sky telluric CO2 absorption deviations (filled: H < 10) | |||||||||||||||||||||||
| 0 | 0 |
|
|
|
|
|
|
| IPAIR | NAME | SHIFT | NEWSHIFT | S/N | NAME | SHIFT | NEWSHIFT | S/N |
| 0 | 06380013 | 0.474430 | 0.00000 | 19.0980 | 06380014 | 0.00428389 | 0.470146 | 19.0729 |
| 1 | 06380017 | 0.472997 | 0.00143299 | 19.1664 | 06380018 | -0.00398488 | 0.478415 | 19.1785 |
| 2 | 06380016 | 0.473148 | 0.00128201 | 19.1375 | 06380015 | 0.00961046 | 0.464820 | 19.1499 |
| 3 | 06380012 | 0.473984 | 0.000445992 | 19.0968 | 06380011 | 0.00000 | 0.474430 | 19.0674 |