| Red | Green | Blue | |
| z | 17.64 | ||
| znorm | Inf | ||
| sky | -Inf | -Inf | -Inf |
| S/N | 26.4 | 45.0 | 46.7 |
| S/N(c) | 0.0 | 0.0 | 0.0 |
| SN(E/C) |

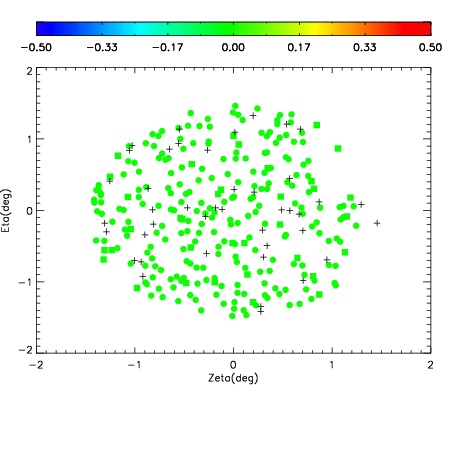
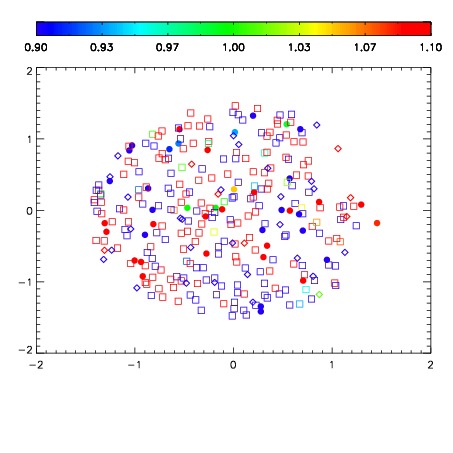


| Frame | Nreads | Zeropoints | Mag plots | Spatial mag deviation | Spatial sky 16325A emission deviations (filled: sky, open: star) | Spatial sky continuum emission | Spatial sky telluric CO2 absorption deviations (filled: H < 10) | |||||||||||||||||||||||
| 0 | 0 |
|
|
|
|
|
|
| IPAIR | NAME | SHIFT | NEWSHIFT | S/N | NAME | SHIFT | NEWSHIFT | S/N |
| 0 | 06400033 | 0.481207 | 0.00000 | 18.7536 | 06400034 | -0.00377850 | 0.484986 | 18.8283 |
| 1 | 06400028 | 0.480161 | 0.00104600 | 18.9630 | 06400027 | 0.00000 | 0.481207 | 18.9606 |
| 2 | 06400029 | 0.481204 | 3.01003e-06 | 18.9450 | 06400031 | 0.000929884 | 0.480277 | 18.9188 |
| 3 | 06400032 | 0.480818 | 0.000389010 | 18.8397 | 06400030 | 0.000472133 | 0.480735 | 18.9000 |