| Red | Green | Blue | |
| z | 17.64 | ||
| znorm | Inf | ||
| sky | -NaN | -Inf | -Inf |
| S/N | 30.8 | 52.3 | 54.1 |
| S/N(c) | 0.0 | 0.0 | 0.0 |
| SN(E/C) |
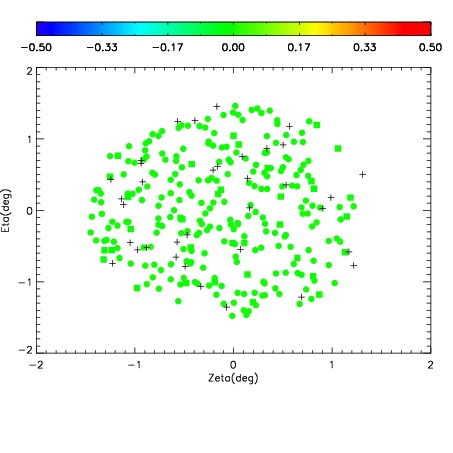
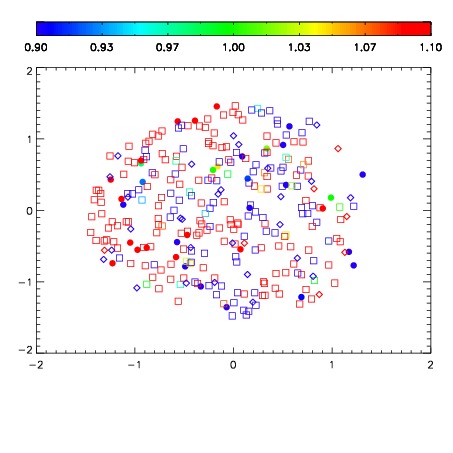
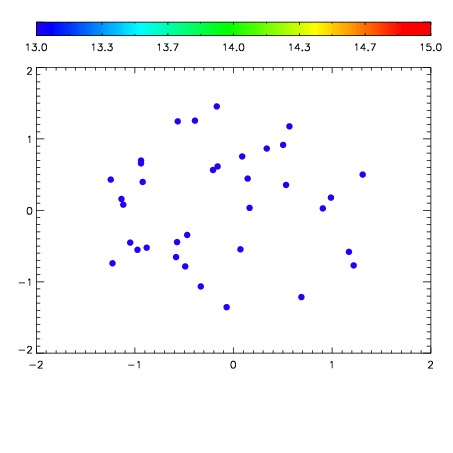

| Frame | Nreads | Zeropoints | Mag plots | Spatial mag deviation | Spatial sky 16325A emission deviations (filled: sky, open: star) | Spatial sky continuum emission | Spatial sky telluric CO2 absorption deviations (filled: H < 10) | |||||||||||||||||||||||
| 0 | 0 |
|
|
|
|
|
|
| IPAIR | NAME | SHIFT | NEWSHIFT | S/N | NAME | SHIFT | NEWSHIFT | S/N |
| 0 | 06340027 | 0.476494 | 0.00000 | 19.1217 | 06340022 | 0.00000 | 0.476494 | 19.2353 |
| 1 | 06340024 | 0.476357 | 0.000137001 | 19.2662 | 06340025 | 0.00684492 | 0.469649 | 19.2620 |
| 2 | 06340023 | 0.476195 | 0.000299007 | 19.2638 | 06340029 | 0.0103735 | 0.466121 | 19.2516 |
| 3 | 06340028 | 0.476430 | 6.40154e-05 | 19.1852 | 06340026 | 0.00413033 | 0.472364 | 19.2460 |