| Red | Green | Blue | |
| z | 17.64 | ||
| znorm | Inf | ||
| sky | -Inf | -Inf | -Inf |
| S/N | 29.4 | 49.4 | 52.5 |
| S/N(c) | 0.0 | 0.0 | 0.0 |
| SN(E/C) |
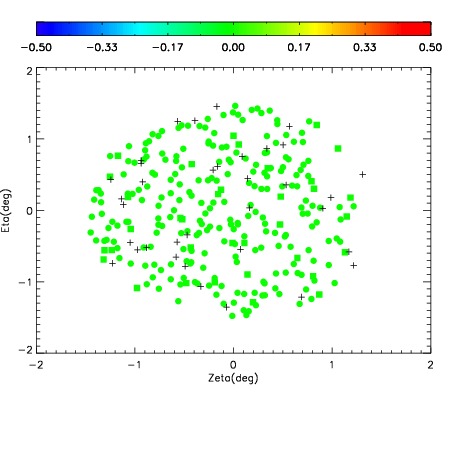
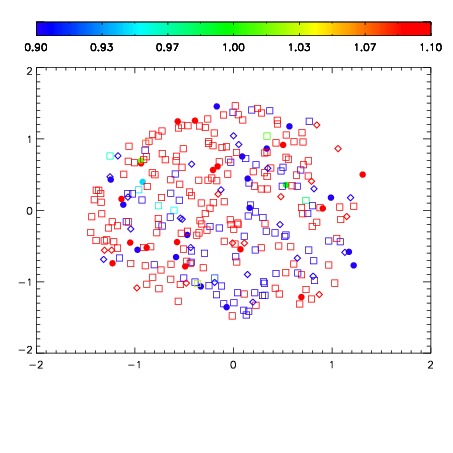


| Frame | Nreads | Zeropoints | Mag plots | Spatial mag deviation | Spatial sky 16325A emission deviations (filled: sky, open: star) | Spatial sky continuum emission | Spatial sky telluric CO2 absorption deviations (filled: H < 10) | |||||||||||||||||||||||
| 0 | 0 |
|
|
|
|
|
|
| IPAIR | NAME | SHIFT | NEWSHIFT | S/N | NAME | SHIFT | NEWSHIFT | S/N |
| 0 | 06610015 | 0.470784 | 0.00000 | 19.1619 | 06610014 | 0.00164214 | 0.469142 | 19.1364 |
| 1 | 06610016 | 0.470685 | 9.90033e-05 | 19.2137 | 06610017 | -0.00175066 | 0.472535 | 19.1759 |
| 2 | 06610012 | 0.469930 | 0.000854015 | 19.0659 | 06610013 | 0.00417279 | 0.466611 | 19.0903 |
| 3 | 06610011 | 0.470365 | 0.000419021 | 19.0463 | 06610010 | 0.00000 | 0.470784 | 18.9877 |