| Red | Green | Blue | |
| z | 17.64 | ||
| znorm | Inf | ||
| sky | -Inf | -NaN | -Inf |
| S/N | 20.0 | 35.5 | 37.0 |
| S/N(c) | 0.0 | 0.0 | 0.0 |
| SN(E/C) |
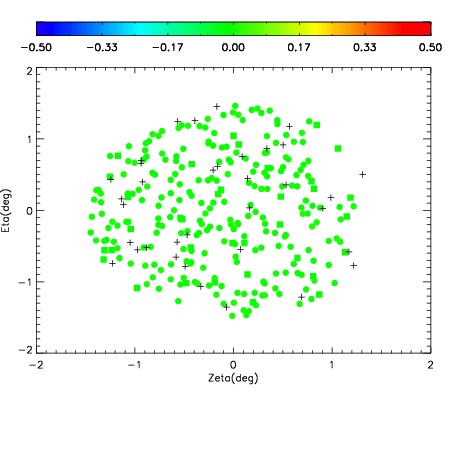
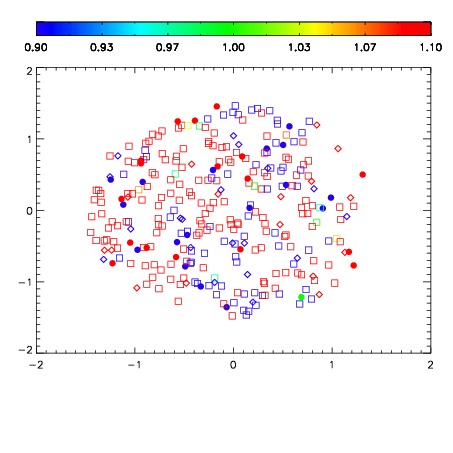
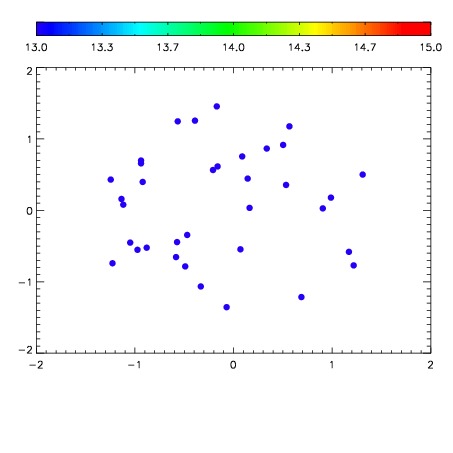

| Frame | Nreads | Zeropoints | Mag plots | Spatial mag deviation | Spatial sky 16325A emission deviations (filled: sky, open: star) | Spatial sky continuum emission | Spatial sky telluric CO2 absorption deviations (filled: H < 10) | |||||||||||||||||||||||
| 0 | 0 |
|
|
|
|
|
|
| IPAIR | NAME | SHIFT | NEWSHIFT | S/N | NAME | SHIFT | NEWSHIFT | S/N |
| 0 | 06650013 | 0.485876 | 0.00000 | 18.6985 | 06650018 | -0.00221607 | 0.488092 | 18.6715 |
| 1 | 06650017 | 0.485119 | 0.000757009 | 18.4869 | 06650015 | -0.00590315 | 0.491779 | 18.6382 |
| 2 | 06650012 | 0.485490 | 0.000386000 | 18.4544 | 06650014 | -0.00301686 | 0.488893 | 18.5534 |
| 3 | 06650016 | 0.484472 | 0.00140399 | 18.4459 | 06650011 | 0.00000 | 0.485876 | 18.1216 |