| Red | Green | Blue | |
| z | 17.64 | ||
| znorm | Inf | ||
| sky | -Inf | -Inf | -NaN |
| S/N | 28.1 | 44.9 | 45.4 |
| S/N(c) | 0.0 | 0.0 | 0.0 |
| SN(E/C) |
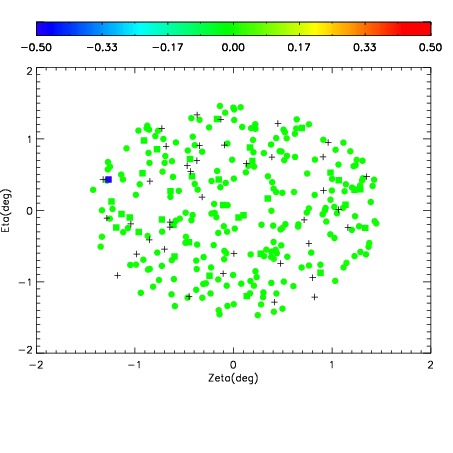


| Frame | Nreads | Zeropoints | Mag plots | Spatial mag deviation | Spatial sky 16325A emission deviations (filled: sky, open: star) | Spatial sky continuum emission | Spatial sky telluric CO2 absorption deviations (filled: H < 10) | |||||||||||||||||||||||
| 0 | 0 |
|
|
|
|
|
|
| IPAIR | NAME | SHIFT | NEWSHIFT | S/N | NAME | SHIFT | NEWSHIFT | S/N |
| 0 | 05280017 | 0.488362 | 0.00000 | 19.1548 | 05280014 | -0.00118965 | 0.489552 | 19.0458 |
| 1 | 05280016 | 0.488047 | 0.000315011 | 19.1557 | 05280015 | 0.00161143 | 0.486751 | 19.1095 |
| 2 | 05280012 | 0.485432 | 0.00293002 | 18.9985 | 05280018 | 0.00161806 | 0.486744 | 19.0431 |
| 3 | 05280013 | 0.485772 | 0.00259000 | 18.9517 | 05280011 | 0.00000 | 0.488362 | 18.9420 |