| Red | Green | Blue | |
| z | 17.64 | ||
| znorm | Inf | ||
| sky | -Inf | -Inf | -Inf |
| S/N | 24.8 | 43.3 | 42.4 |
| S/N(c) | 0.0 | 0.0 | 0.0 |
| SN(E/C) |
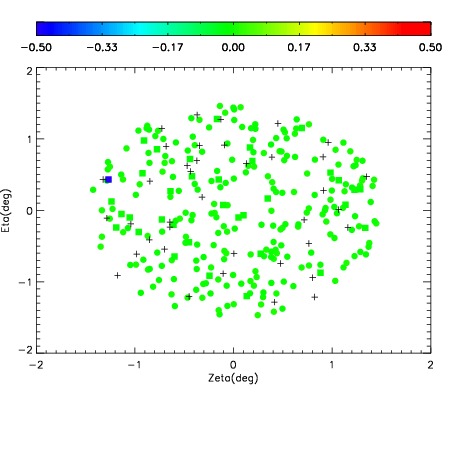
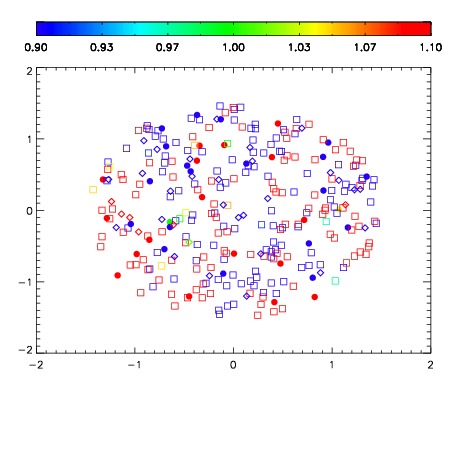


| Frame | Nreads | Zeropoints | Mag plots | Spatial mag deviation | Spatial sky 16325A emission deviations (filled: sky, open: star) | Spatial sky continuum emission | Spatial sky telluric CO2 absorption deviations (filled: H < 10) | |||||||||||||||||||||||
| 0 | 0 |
|
|
|
|
|
|
| IPAIR | NAME | SHIFT | NEWSHIFT | S/N | NAME | SHIFT | NEWSHIFT | S/N |
| 0 | 05480064 | 0.489262 | 0.00000 | 18.9252 | 05480065 | 0.00503034 | 0.484232 | 18.9498 |
| 1 | 05480060 | 0.488305 | 0.000957012 | 18.8682 | 05480061 | 0.00270699 | 0.486555 | 18.9282 |
| 2 | 05480063 | 0.488444 | 0.000818014 | 18.8227 | 05480058 | 0.00000 | 0.489262 | 18.9080 |
| 3 | 05480059 | 0.486215 | 0.00304702 | 18.7801 | 05480062 | 0.00193704 | 0.487325 | 18.8365 |