| Red | Green | Blue | |
| z | 17.64 | ||
| znorm | Inf | ||
| sky | -Inf | -Inf | -NaN |
| S/N | 28.4 | 47.3 | 50.0 |
| S/N(c) | 0.0 | 0.0 | 0.0 |
| SN(E/C) |

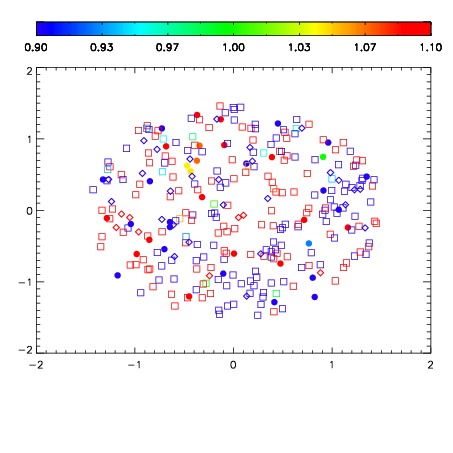
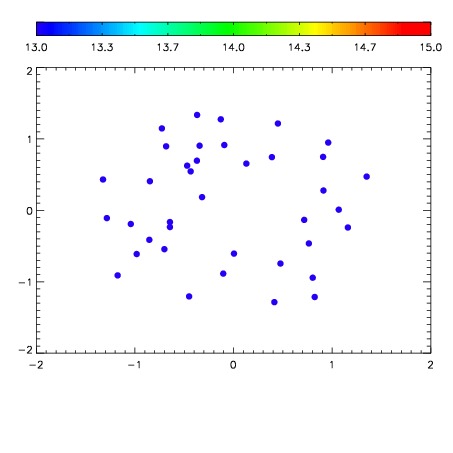

| Frame | Nreads | Zeropoints | Mag plots | Spatial mag deviation | Spatial sky 16325A emission deviations (filled: sky, open: star) | Spatial sky continuum emission | Spatial sky telluric CO2 absorption deviations (filled: H < 10) | |||||||||||||||||||||||
| 0 | 0 |
|
|
|
|
|
|
| IPAIR | NAME | SHIFT | NEWSHIFT | S/N | NAME | SHIFT | NEWSHIFT | S/N |
| 0 | 06110027 | 0.483949 | 0.00000 | 19.1549 | 06110028 | 0.00260930 | 0.481340 | 19.1401 |
| 1 | 06110026 | 0.483856 | 9.30130e-05 | 19.1021 | 06110024 | 0.00172099 | 0.482228 | 19.0307 |
| 2 | 06110022 | 0.482259 | 0.00169000 | 19.0686 | 06110025 | 0.000560305 | 0.483389 | 19.0198 |
| 3 | 06110023 | 0.482844 | 0.00110501 | 19.0244 | 06110021 | 0.00000 | 0.483949 | 19.0196 |