| Red | Green | Blue | |
| z | 17.64 | ||
| znorm | Inf | ||
| sky | -Inf | -Inf | -Inf |
| S/N | 26.1 | 45.0 | 48.3 |
| S/N(c) | 0.0 | 0.0 | 0.0 |
| SN(E/C) |
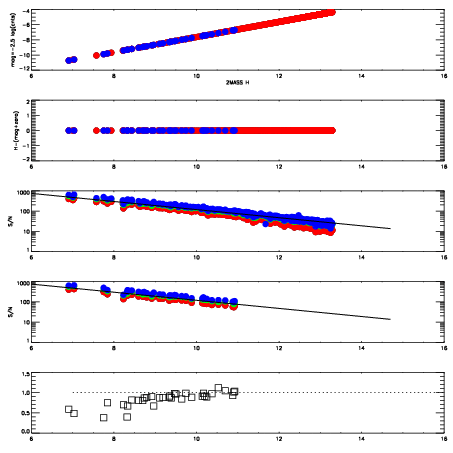

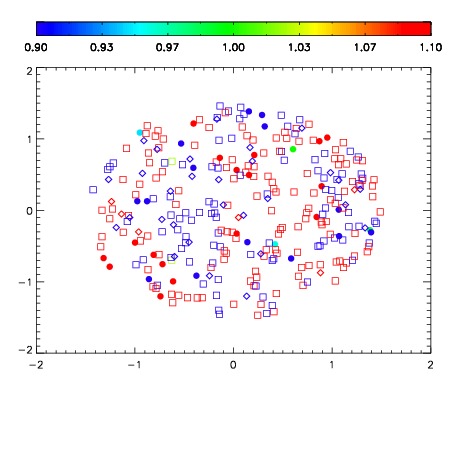


| Frame | Nreads | Zeropoints | Mag plots | Spatial mag deviation | Spatial sky 16325A emission deviations (filled: sky, open: star) | Spatial sky continuum emission | Spatial sky telluric CO2 absorption deviations (filled: H < 10) | |||||||||||||||||||||||
| 0 | 0 |
|
|
|
|
|
|
| IPAIR | NAME | SHIFT | NEWSHIFT | S/N | NAME | SHIFT | NEWSHIFT | S/N |
| 0 | 06310028 | 0.481481 | 0.00000 | 19.0666 | 06310026 | 0.00000 | 0.481481 | 19.0289 |
| 1 | 06310027 | 0.480973 | 0.000507981 | 19.0605 | 06310033 | 0.00482234 | 0.476659 | 19.0289 |
| 2 | 06310032 | 0.479720 | 0.00176099 | 19.0316 | 06310030 | 0.00203288 | 0.479448 | 18.9628 |
| 3 | 06310031 | 0.478346 | 0.00313500 | 18.9964 | 06310029 | 0.00243399 | 0.479047 | 18.8989 |