| Red | Green | Blue | |
| z | 17.64 | ||
| znorm | Inf | ||
| sky | -Inf | -Inf | -Inf |
| S/N | 27.5 | 46.9 | 51.1 |
| S/N(c) | 0.0 | 0.0 | 0.0 |
| SN(E/C) |
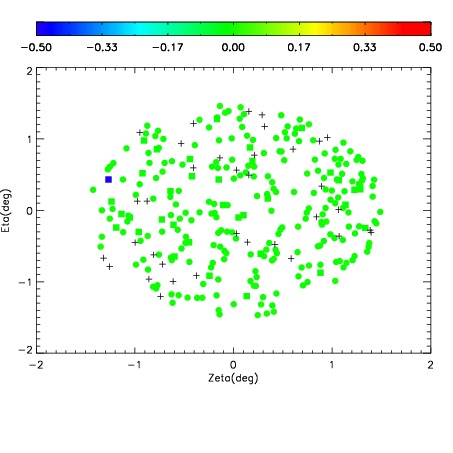


| Frame | Nreads | Zeropoints | Mag plots | Spatial mag deviation | Spatial sky 16325A emission deviations (filled: sky, open: star) | Spatial sky continuum emission | Spatial sky telluric CO2 absorption deviations (filled: H < 10) | |||||||||||||||||||||||
| 0 | 0 |
|
|
|
|
|
|
| IPAIR | NAME | SHIFT | NEWSHIFT | S/N | NAME | SHIFT | NEWSHIFT | S/N |
| 0 | 06590016 | 0.471615 | 0.00000 | 19.1302 | 06590017 | -0.00175475 | 0.473370 | 19.1348 |
| 1 | 06590012 | 0.470871 | 0.000743985 | 19.1418 | 06590014 | 0.00476351 | 0.466851 | 19.1468 |
| 2 | 06590015 | 0.470703 | 0.000911981 | 19.1364 | 06590013 | 0.000307503 | 0.471307 | 19.1388 |
| 3 | 06590011 | 0.470761 | 0.000853986 | 19.1268 | 06590010 | 0.00000 | 0.471615 | 19.0969 |