| Red | Green | Blue | |
| z | 17.64 | ||
| znorm | Inf | ||
| sky | -Inf | -Inf | -Inf |
| S/N | 29.4 | 50.9 | 54.4 |
| S/N(c) | 0.0 | 0.0 | 0.0 |
| SN(E/C) |

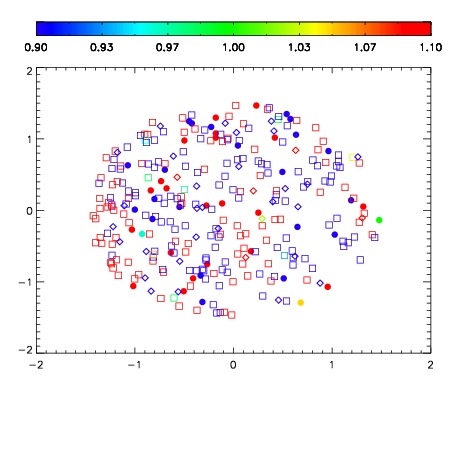


| Frame | Nreads | Zeropoints | Mag plots | Spatial mag deviation | Spatial sky 16325A emission deviations (filled: sky, open: star) | Spatial sky continuum emission | Spatial sky telluric CO2 absorption deviations (filled: H < 10) | |||||||||||||||||||||||
| 0 | 0 |
|
|
|
|
|
|
| IPAIR | NAME | SHIFT | NEWSHIFT | S/N | NAME | SHIFT | NEWSHIFT | S/N |
| 0 | 05230075 | 0.494068 | 0.00000 | 19.1948 | 05230072 | 0.000310364 | 0.493758 | 19.2163 |
| 1 | 05230071 | 0.491306 | 0.00276199 | 19.1935 | 05230073 | 0.00138176 | 0.492686 | 19.2145 |
| 2 | 05230074 | 0.493101 | 0.000966996 | 19.1443 | 05230076 | -0.000331832 | 0.494400 | 19.1769 |
| 3 | 05230070 | 0.490583 | 0.00348499 | 19.1077 | 05230069 | 0.00000 | 0.494068 | 19.1740 |