| Red | Green | Blue | |
| z | 17.64 | ||
| znorm | Inf | ||
| sky | -Inf | -NaN | -Inf |
| S/N | 23.3 | 41.1 | 44.3 |
| S/N(c) | 0.0 | 0.0 | 0.0 |
| SN(E/C) |
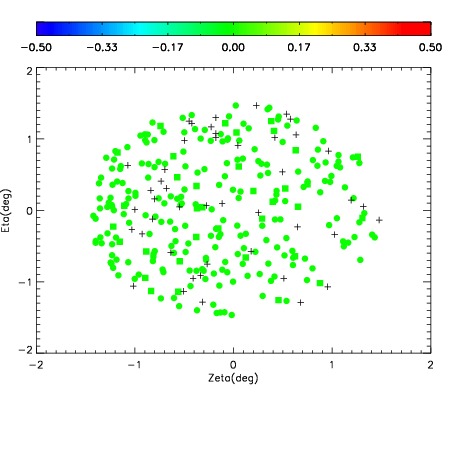
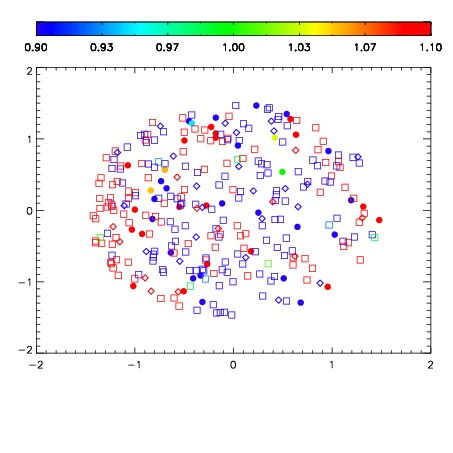
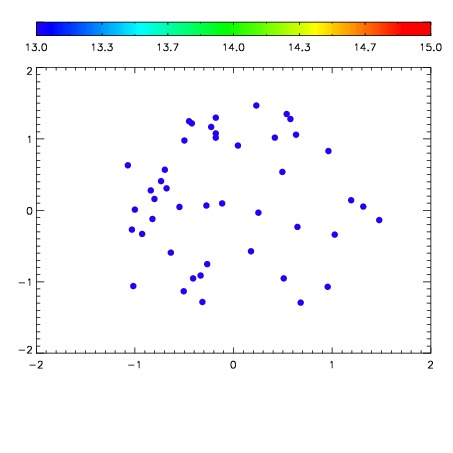

| Frame | Nreads | Zeropoints | Mag plots | Spatial mag deviation | Spatial sky 16325A emission deviations (filled: sky, open: star) | Spatial sky continuum emission | Spatial sky telluric CO2 absorption deviations (filled: H < 10) | |||||||||||||||||||||||
| 0 | 0 |
|
|
|
|
|
|
| IPAIR | NAME | SHIFT | NEWSHIFT | S/N | NAME | SHIFT | NEWSHIFT | S/N |
| 0 | 05490054 | 0.484938 | 0.00000 | 18.8887 | 05490052 | -0.00103557 | 0.485974 | 18.8528 |
| 1 | 05490049 | 0.481335 | 0.00360298 | 18.9802 | 05490048 | 0.00000 | 0.484938 | 18.9906 |
| 2 | 05490050 | 0.482427 | 0.00251099 | 18.9645 | 05490055 | 2.29462e-05 | 0.484915 | 18.9254 |
| 3 | 05490053 | 0.484722 | 0.000216007 | 18.9033 | 05490051 | -0.000768093 | 0.485706 | 18.9000 |