| Red | Green | Blue | |
| z | 17.64 | ||
| znorm | Inf | ||
| sky | -Inf | -Inf | -Inf |
| S/N | 28.4 | 49.4 | 50.9 |
| S/N(c) | 0.0 | 0.0 | 0.0 |
| SN(E/C) |
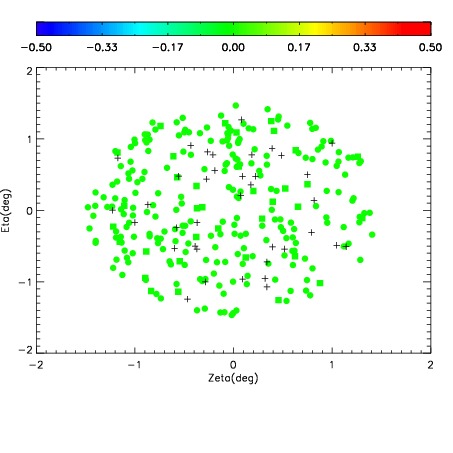

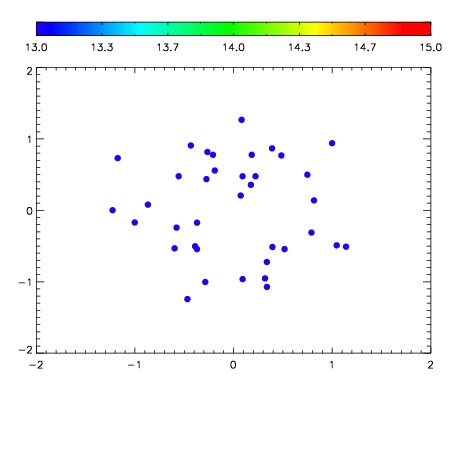

| Frame | Nreads | Zeropoints | Mag plots | Spatial mag deviation | Spatial sky 16325A emission deviations (filled: sky, open: star) | Spatial sky continuum emission | Spatial sky telluric CO2 absorption deviations (filled: H < 10) | |||||||||||||||||||||||
| 0 | 0 |
|
|
|
|
|
|
| IPAIR | NAME | SHIFT | NEWSHIFT | S/N | NAME | SHIFT | NEWSHIFT | S/N |
| 0 | 06100031 | 0.488836 | 0.00000 | 19.0408 | 06100029 | 0.000533675 | 0.488302 | 19.0272 |
| 1 | 06100026 | 0.487400 | 0.00143600 | 19.0149 | 06100025 | 0.00000 | 0.488836 | 19.0035 |
| 2 | 06100030 | 0.488578 | 0.000257999 | 19.0098 | 06100032 | 0.00225953 | 0.486576 | 18.9990 |
| 3 | 06100027 | 0.488406 | 0.000429988 | 18.9424 | 06100028 | 0.00107915 | 0.487757 | 18.9907 |