| Red | Green | Blue | |
| z | 17.64 | ||
| znorm | Inf | ||
| sky | -Inf | -Inf | -Inf |
| S/N | 20.9 | 37.3 | 39.4 |
| S/N(c) | 0.0 | 0.0 | 0.0 |
| SN(E/C) |
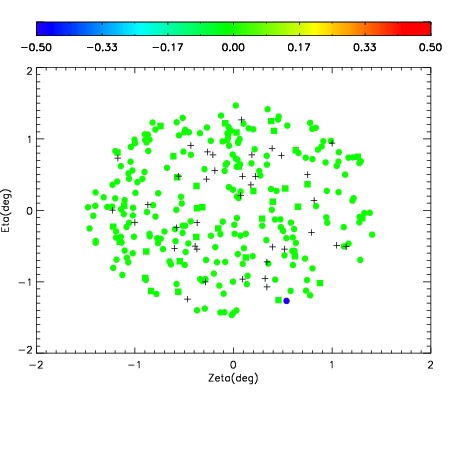
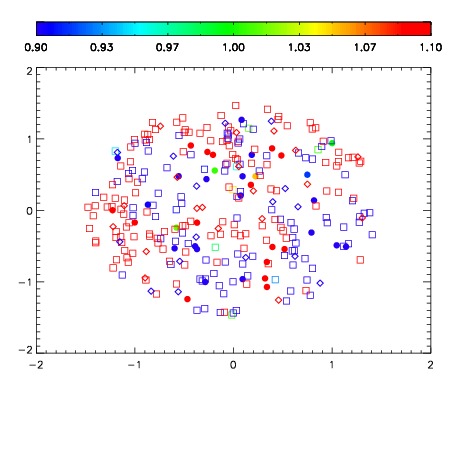


| Frame | Nreads | Zeropoints | Mag plots | Spatial mag deviation | Spatial sky 16325A emission deviations (filled: sky, open: star) | Spatial sky continuum emission | Spatial sky telluric CO2 absorption deviations (filled: H < 10) | |||||||||||||||||||||||
| 0 | 0 |
|
|
|
|
|
|
| IPAIR | NAME | SHIFT | NEWSHIFT | S/N | NAME | SHIFT | NEWSHIFT | S/N |
| 0 | 06640012 | 0.484943 | 0.00000 | 17.9907 | 06640013 | 0.00234319 | 0.482600 | 18.2864 |
| 1 | 06640016 | 0.482419 | 0.00252399 | 18.9633 | 06640017 | -0.00143613 | 0.486379 | 19.0389 |
| 2 | 06640015 | 0.481957 | 0.00298601 | 18.7664 | 06640014 | -1.50290e-05 | 0.484958 | 18.6827 |
| 3 | 06640011 | 0.484430 | 0.000513017 | 18.1103 | 06640010 | 0.00000 | 0.484943 | 18.3191 |