| Red | Green | Blue | |
| z | 17.64 | ||
| znorm | Inf | ||
| sky | -NaN | -Inf | -Inf |
| S/N | 29.3 | 48.0 | 51.3 |
| S/N(c) | 0.0 | 0.0 | 0.0 |
| SN(E/C) |
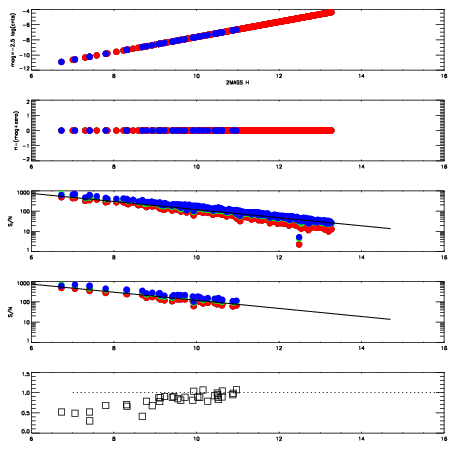
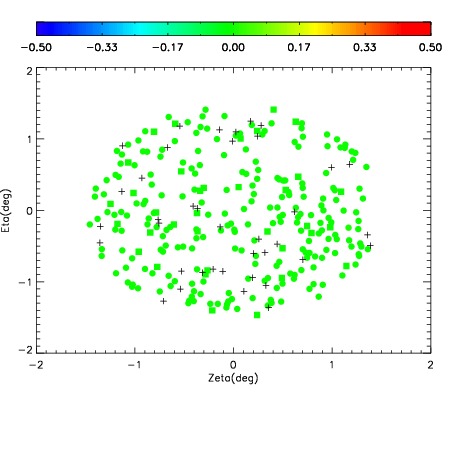

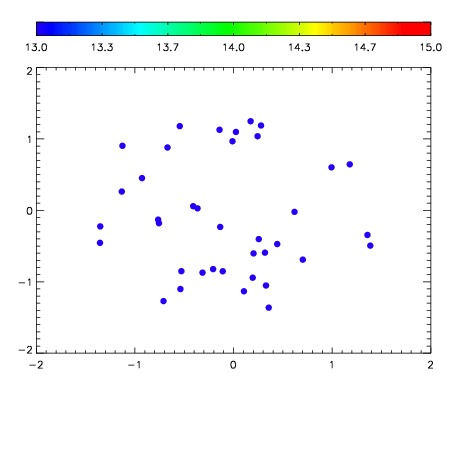

| Frame | Nreads | Zeropoints | Mag plots | Spatial mag deviation | Spatial sky 16325A emission deviations (filled: sky, open: star) | Spatial sky continuum emission | Spatial sky telluric CO2 absorption deviations (filled: H < 10) | |||||||||||||||||||||||
| 0 | 0 |
|
|
|
|
|
|
| IPAIR | NAME | SHIFT | NEWSHIFT | S/N | NAME | SHIFT | NEWSHIFT | S/N |
| 0 | 05200075 | 0.494357 | 0.00000 | 19.1979 | 05200072 | 0.00132265 | 0.493034 | 19.2016 |
| 1 | 05200074 | 0.493476 | 0.000880986 | 19.1821 | 05200073 | -0.000980535 | 0.495338 | 19.1968 |
| 2 | 05200071 | 0.489336 | 0.00502098 | 19.1602 | 05200076 | -0.000498969 | 0.494856 | 19.1877 |
| 3 | 05200070 | 0.487900 | 0.00645700 | 19.1183 | 05200069 | 0.00000 | 0.494357 | 19.1683 |