| Red | Green | Blue | |
| z | 17.64 | ||
| znorm | Inf | ||
| sky | -NaN | -NaN | -Inf |
| S/N | 32.3 | 54.0 | 58.3 |
| S/N(c) | 0.0 | 0.0 | 0.0 |
| SN(E/C) |
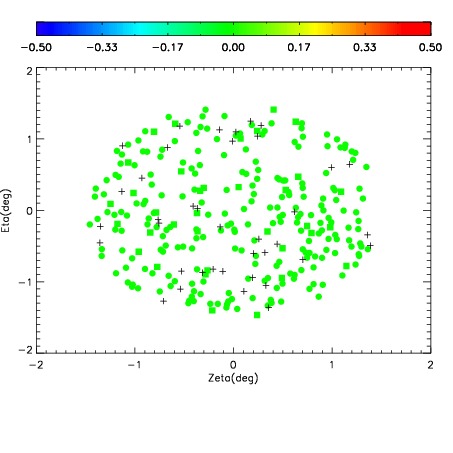
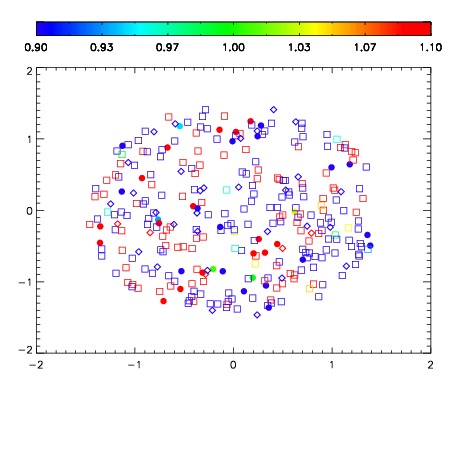


| Frame | Nreads | Zeropoints | Mag plots | Spatial mag deviation | Spatial sky 16325A emission deviations (filled: sky, open: star) | Spatial sky continuum emission | Spatial sky telluric CO2 absorption deviations (filled: H < 10) | |||||||||||||||||||||||
| 0 | 0 |
|
|
|
|
|
|
| IPAIR | NAME | SHIFT | NEWSHIFT | S/N | NAME | SHIFT | NEWSHIFT | S/N |
| 0 | 05240076 | 0.492689 | 0.00000 | 19.1278 | 05240081 | 0.00260782 | 0.490081 | 19.0953 |
| 1 | 05240079 | 0.491683 | 0.00100601 | 19.2058 | 05240078 | 2.34247e-05 | 0.492666 | 19.2056 |
| 2 | 05240080 | 0.492572 | 0.000117004 | 19.1820 | 05240074 | 0.00000 | 0.492689 | 19.2040 |
| 3 | 05240075 | 0.492609 | 8.00192e-05 | 19.1606 | 05240077 | 0.00190948 | 0.490780 | 19.1775 |
| 4 | 05240083 | 0.491866 | 0.000823021 | 18.9888 | 05240082 | 0.00197274 | 0.490716 | 19.0693 |