| Red | Green | Blue | |
| z | 17.64 | ||
| znorm | Inf | ||
| sky | -Inf | -Inf | -Inf |
| S/N | 28.0 | 47.5 | 51.0 |
| S/N(c) | 0.0 | 0.0 | 0.0 |
| SN(E/C) |
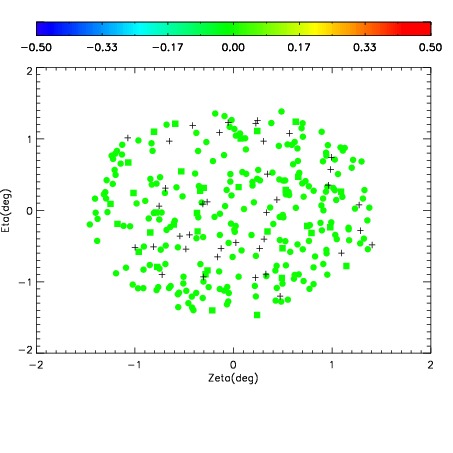
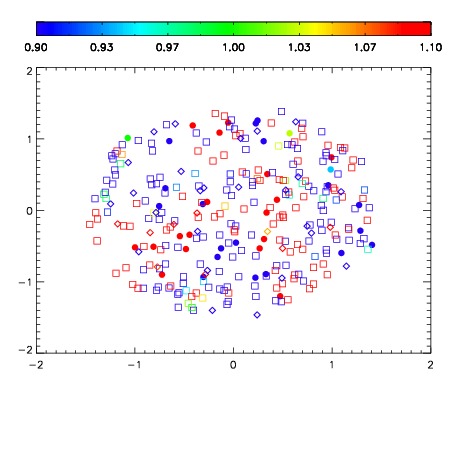
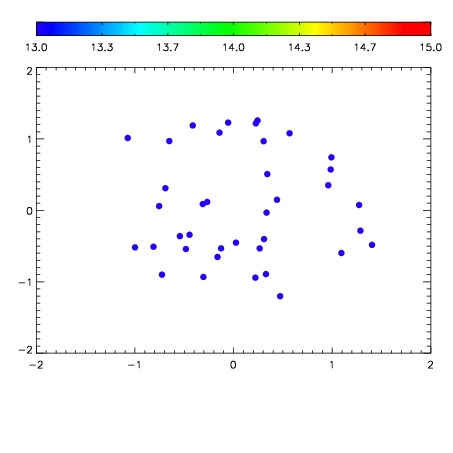

| Frame | Nreads | Zeropoints | Mag plots | Spatial mag deviation | Spatial sky 16325A emission deviations (filled: sky, open: star) | Spatial sky continuum emission | Spatial sky telluric CO2 absorption deviations (filled: H < 10) | |||||||||||||||||||||||
| 0 | 0 |
|
|
|
|
|
|
| IPAIR | NAME | SHIFT | NEWSHIFT | S/N | NAME | SHIFT | NEWSHIFT | S/N |
| 0 | 05220069 | 0.498107 | 0.00000 | 19.2397 | 05220070 | 0.00233325 | 0.495774 | 19.2298 |
| 1 | 05220068 | 0.497416 | 0.000690997 | 19.1991 | 05220067 | 0.000652497 | 0.497454 | 19.2081 |
| 2 | 05220064 | 0.495266 | 0.00284100 | 19.1487 | 05220066 | 0.00258973 | 0.495517 | 19.1749 |
| 3 | 05220065 | 0.495514 | 0.00259298 | 19.1280 | 05220063 | 0.00000 | 0.498107 | 19.1727 |