| Red | Green | Blue | |
| z | 17.64 | ||
| znorm | Inf | ||
| sky | -Inf | -Inf | -NaN |
| S/N | 24.6 | 43.0 | 47.4 |
| S/N(c) | 0.0 | 0.0 | 0.0 |
| SN(E/C) |
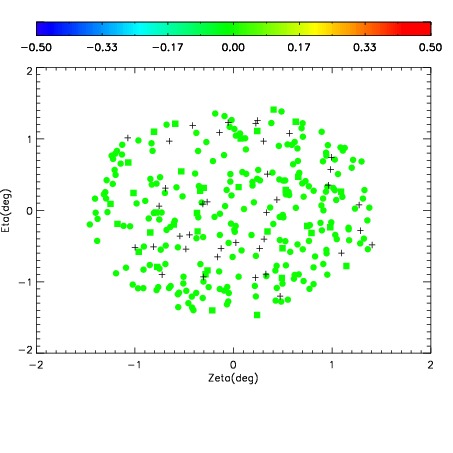

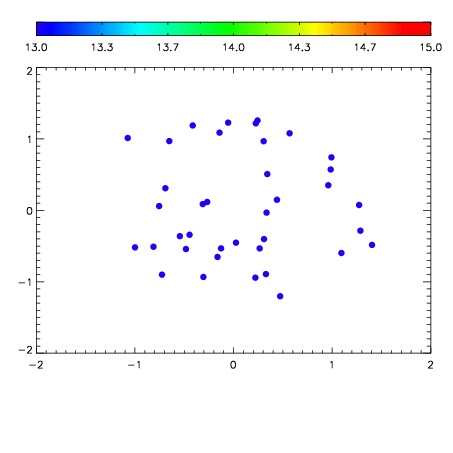

| Frame | Nreads | Zeropoints | Mag plots | Spatial mag deviation | Spatial sky 16325A emission deviations (filled: sky, open: star) | Spatial sky continuum emission | Spatial sky telluric CO2 absorption deviations (filled: H < 10) | |||||||||||||||||||||||
| 0 | 0 |
|
|
|
|
|
|
| IPAIR | NAME | SHIFT | NEWSHIFT | S/N | NAME | SHIFT | NEWSHIFT | S/N |
| 0 | 05260041 | 0.488111 | 0.00000 | 19.0075 | 05260039 | 0.00000 | 0.488111 | 18.9796 |
| 1 | 05260040 | 0.487882 | 0.000229001 | 18.9941 | 05260042 | -0.00171051 | 0.489821 | 18.9766 |
| 2 | 05260044 | 0.482412 | 0.00569898 | 18.9905 | 05260043 | -0.00299720 | 0.491108 | 18.9291 |
| 3 | 05260045 | 0.483495 | 0.00461599 | 18.9345 | 05260046 | -0.00398914 | 0.492100 | 18.9050 |