| Red | Green | Blue | |
| z | 17.64 | ||
| znorm | Inf | ||
| sky | -Inf | -Inf | -NaN |
| S/N | 16.8 | 29.5 | 32.0 |
| S/N(c) | 0.0 | 0.0 | 0.0 |
| SN(E/C) |
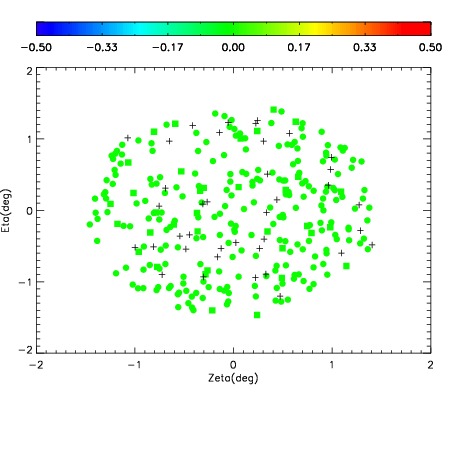

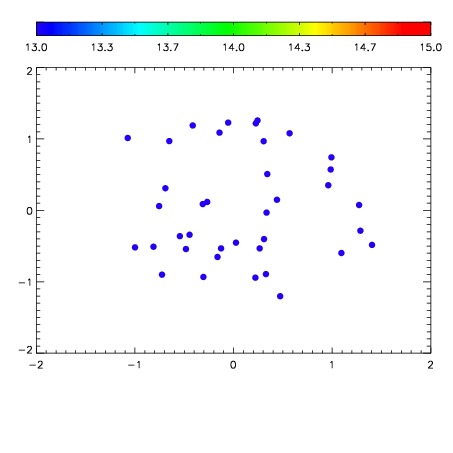

| Frame | Nreads | Zeropoints | Mag plots | Spatial mag deviation | Spatial sky 16325A emission deviations (filled: sky, open: star) | Spatial sky continuum emission | Spatial sky telluric CO2 absorption deviations (filled: H < 10) | |||||||||||||||||||||||
| 0 | 0 |
|
|
|
|
|
|
| IPAIR | NAME | SHIFT | NEWSHIFT | S/N | NAME | SHIFT | NEWSHIFT | S/N |
| 0 | 05300022 | 0.485510 | 0.00000 | 18.8970 | 05300023 | 7.81645e-05 | 0.485432 | 18.9367 |
| 1 | 05300021 | 0.485418 | 9.19998e-05 | 18.7550 | 05300020 | 0.00000 | 0.485510 | 18.6654 |