| Red | Green | Blue | |
| z | 17.64 | ||
| znorm | Inf | ||
| sky | -Inf | -Inf | -Inf |
| S/N | 28.7 | 47.8 | 51.2 |
| S/N(c) | 0.0 | 0.0 | 0.0 |
| SN(E/C) |


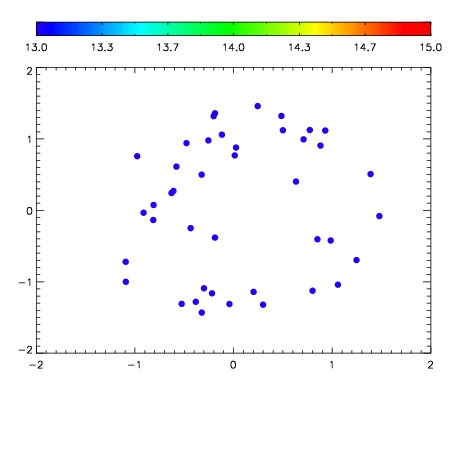

| Frame | Nreads | Zeropoints | Mag plots | Spatial mag deviation | Spatial sky 16325A emission deviations (filled: sky, open: star) | Spatial sky continuum emission | Spatial sky telluric CO2 absorption deviations (filled: H < 10) | |||||||||||||||||||||||
| 0 | 0 |
|
|
|
|
|
|
| IPAIR | NAME | SHIFT | NEWSHIFT | S/N | NAME | SHIFT | NEWSHIFT | S/N |
| 0 | 06070038 | 0.477943 | 0.00000 | 19.1436 | 06070036 | 0.00000 | 0.477943 | 19.0910 |
| 1 | 06070041 | 0.476467 | 0.00147599 | 19.1790 | 06070040 | 0.000394726 | 0.477548 | 19.1604 |
| 2 | 06070042 | 0.477373 | 0.000569999 | 19.1517 | 06070039 | 0.00199887 | 0.475944 | 19.1447 |
| 3 | 06070037 | 0.477673 | 0.000270009 | 19.1109 | 06070043 | -0.00328825 | 0.481231 | 18.9637 |