| Red | Green | Blue | |
| z | 17.64 | ||
| znorm | Inf | ||
| sky | -Inf | -Inf | -Inf |
| S/N | 29.4 | 50.8 | 51.9 |
| S/N(c) | 0.0 | 0.0 | 0.0 |
| SN(E/C) |


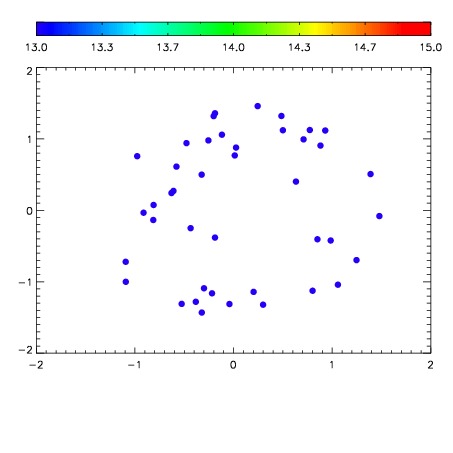

| Frame | Nreads | Zeropoints | Mag plots | Spatial mag deviation | Spatial sky 16325A emission deviations (filled: sky, open: star) | Spatial sky continuum emission | Spatial sky telluric CO2 absorption deviations (filled: H < 10) | |||||||||||||||||||||||
| 0 | 0 |
|
|
|
|
|
|
| IPAIR | NAME | SHIFT | NEWSHIFT | S/N | NAME | SHIFT | NEWSHIFT | S/N |
| 0 | 06110038 | 0.483445 | 0.00000 | 19.1611 | 06110039 | 0.000352527 | 0.483092 | 19.1068 |
| 1 | 06110037 | 0.482863 | 0.000581980 | 19.1787 | 06110036 | 0.00000 | 0.483445 | 19.1684 |
| 2 | 06110041 | 0.480217 | 0.00322798 | 19.0340 | 06110043 | -0.00357601 | 0.487021 | 19.0752 |
| 3 | 06110042 | 0.480662 | 0.00278300 | 18.9953 | 06110040 | -0.000968114 | 0.484413 | 19.0681 |