| Red | Green | Blue | |
| z | 17.64 | ||
| znorm | Inf | ||
| sky | -NaN | -NaN | -Inf |
| S/N | 24.7 | 43.6 | 45.4 |
| S/N(c) | 0.0 | 0.0 | 0.0 |
| SN(E/C) |

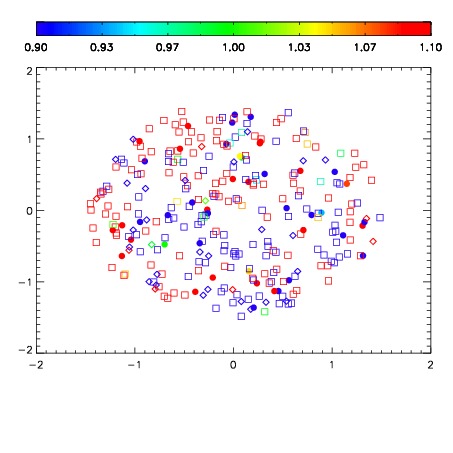


| Frame | Nreads | Zeropoints | Mag plots | Spatial mag deviation | Spatial sky 16325A emission deviations (filled: sky, open: star) | Spatial sky continuum emission | Spatial sky telluric CO2 absorption deviations (filled: H < 10) | |||||||||||||||||||||||
| 0 | 0 |
|
|
|
|
|
|
| IPAIR | NAME | SHIFT | NEWSHIFT | S/N | NAME | SHIFT | NEWSHIFT | S/N |
| 0 | 05480075 | 0.490038 | 0.00000 | 18.9668 | 05480076 | 0.00228818 | 0.487750 | 18.9710 |
| 1 | 05480074 | 0.488806 | 0.00123200 | 18.9311 | 05480073 | -3.67108e-05 | 0.490075 | 18.9520 |
| 2 | 05480070 | 0.486407 | 0.00363100 | 18.8843 | 05480069 | 0.00000 | 0.490038 | 18.8672 |
| 3 | 05480071 | 0.487132 | 0.00290599 | 18.8710 | 05480072 | 0.000281362 | 0.489757 | 18.8454 |