| Red | Green | Blue | |
| z | 17.64 | ||
| znorm | Inf | ||
| sky | -NaN | -Inf | -Inf |
| S/N | 22.8 | 41.8 | 40.9 |
| S/N(c) | 0.0 | 0.0 | 0.0 |
| SN(E/C) |

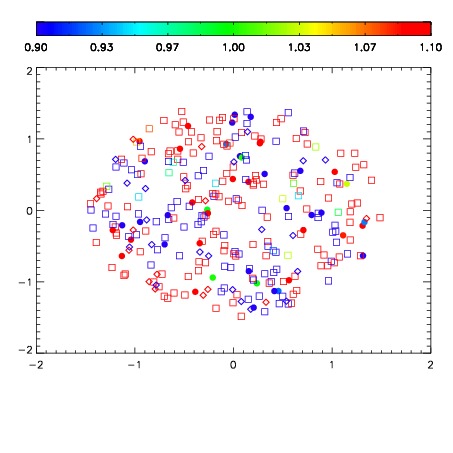


| Frame | Nreads | Zeropoints | Mag plots | Spatial mag deviation | Spatial sky 16325A emission deviations (filled: sky, open: star) | Spatial sky continuum emission | Spatial sky telluric CO2 absorption deviations (filled: H < 10) | |||||||||||||||||||||||
| 0 | 0 |
|
|
|
|
|
|
| IPAIR | NAME | SHIFT | NEWSHIFT | S/N | NAME | SHIFT | NEWSHIFT | S/N |
| 0 | 06080042 | 0.485013 | 0.00000 | 18.7984 | 06080039 | 0.000807853 | 0.484205 | 18.8519 |
| 1 | 06080041 | 0.484369 | 0.000643998 | 18.7967 | 06080036 | 0.00000 | 0.485013 | 18.8354 |
| 2 | 06080037 | 0.483253 | 0.00176001 | 18.7762 | 06080040 | -0.000174312 | 0.485187 | 18.8115 |
| 3 | 06080038 | 0.483794 | 0.00121900 | 18.7554 | 06080043 | 0.00231988 | 0.482693 | 18.8011 |