| Red | Green | Blue | |
| z | 17.63 | ||
| znorm | Inf | ||
| sky | -NaN | -NaN | -Inf |
| S/N | 39.5 | 66.2 | 69.5 |
| S/N(c) | 0.0 | 0.0 | 0.0 |
| SN(E/C) |
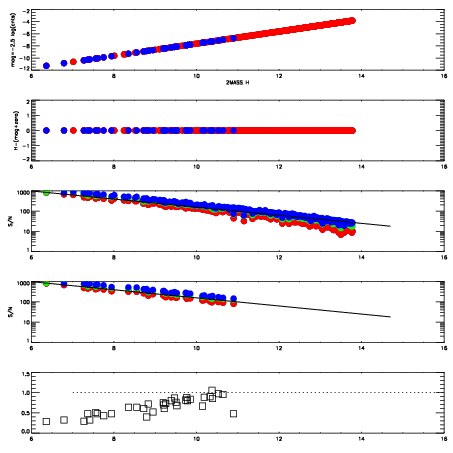
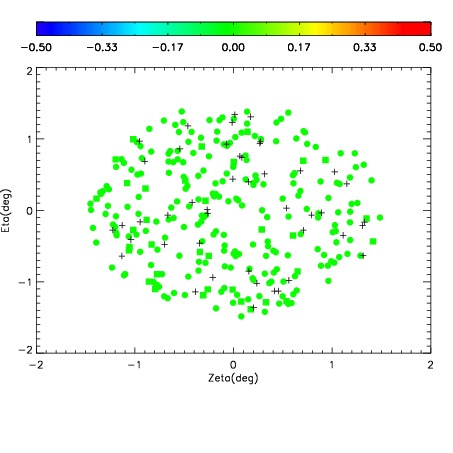
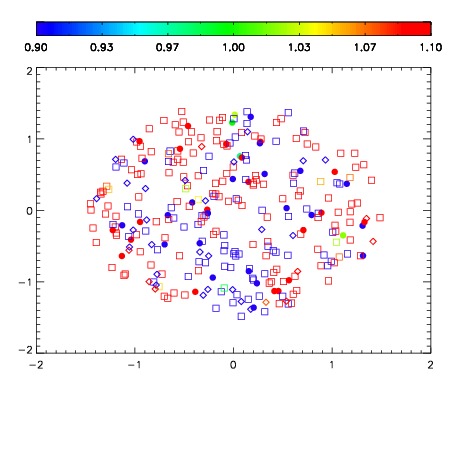


| Frame | Nreads | Zeropoints | Mag plots | Spatial mag deviation | Spatial sky 16325A emission deviations (filled: sky, open: star) | Spatial sky continuum emission | Spatial sky telluric CO2 absorption deviations (filled: H < 10) | |||||||||||||||||||||||
| 0 | 0 |
|
|
|
|
|
|
| IPAIR | NAME | SHIFT | NEWSHIFT | S/N | NAME | SHIFT | NEWSHIFT | S/N |
| 0 | 06410034 | 0.483029 | 0.00000 | 19.1808 | 06410036 | 0.00339235 | 0.479637 | 19.1598 |
| 1 | 06410027 | 0.482504 | 0.000524998 | 19.2197 | 06410028 | 0.000547530 | 0.482481 | 19.2174 |
| 2 | 06410026 | 0.481990 | 0.00103900 | 19.2106 | 06410025 | 0.00000 | 0.483029 | 19.2016 |
| 3 | 06410030 | 0.481146 | 0.00188300 | 19.2032 | 06410032 | 0.00105451 | 0.481975 | 19.1970 |
| 4 | 06410031 | 0.482006 | 0.00102299 | 19.1957 | 06410029 | -0.000260517 | 0.483290 | 19.1941 |
| 5 | 06410035 | 0.482923 | 0.000106007 | 19.1901 | 06410033 | 0.00222061 | 0.480808 | 19.1859 |
| 6 | 06410038 | 0.483014 | 1.50204e-05 | 19.1421 | 06410037 | 0.00178925 | 0.481240 | 19.1169 |