| Red | Green | Blue | |
| z | 17.64 | ||
| znorm | Inf | ||
| sky | -Inf | -Inf | -Inf |
| S/N | 24.8 | 43.2 | 46.5 |
| S/N(c) | 0.0 | 0.0 | 0.0 |
| SN(E/C) |
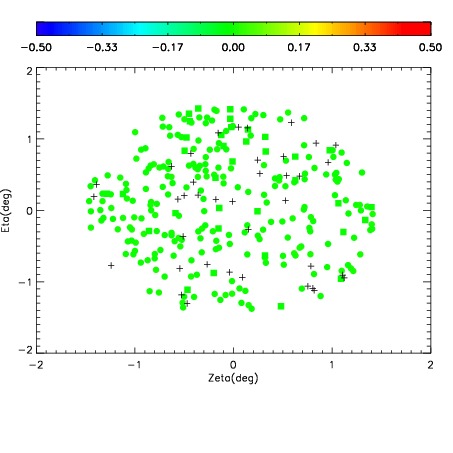

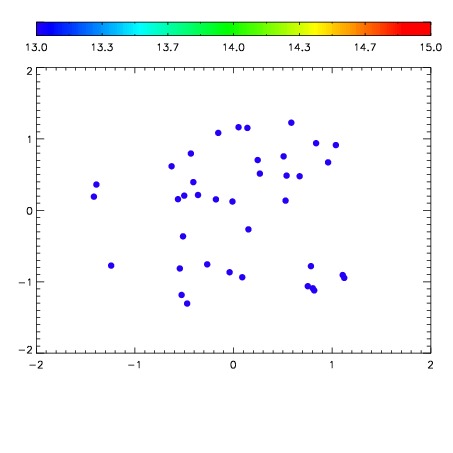

| Frame | Nreads | Zeropoints | Mag plots | Spatial mag deviation | Spatial sky 16325A emission deviations (filled: sky, open: star) | Spatial sky continuum emission | Spatial sky telluric CO2 absorption deviations (filled: H < 10) | |||||||||||||||||||||||
| 0 | 0 |
|
|
|
|
|
|
| IPAIR | NAME | SHIFT | NEWSHIFT | S/N | NAME | SHIFT | NEWSHIFT | S/N |
| 0 | 02790027 | 0.418430 | 0.00000 | 18.8901 | 02790028 | -0.000391165 | 0.418821 | 18.9489 |
| 1 | 02790031 | 0.417625 | 0.000804991 | 18.9261 | 02790029 | -0.00158148 | 0.420011 | 18.9940 |
| 2 | 02790030 | 0.414414 | 0.00401601 | 18.9019 | 02790025 | 0.00000 | 0.418430 | 18.9587 |
| 3 | 02790026 | 0.416005 | 0.00242501 | 18.8462 | 02790032 | -0.000495291 | 0.418925 | 18.9112 |