| Red | Green | Blue | |
| z | 17.64 | ||
| znorm | Inf | ||
| sky | -Inf | -Inf | -NaN |
| S/N | 28.9 | 49.3 | 53.1 |
| S/N(c) | 0.0 | 0.0 | 0.0 |
| SN(E/C) |
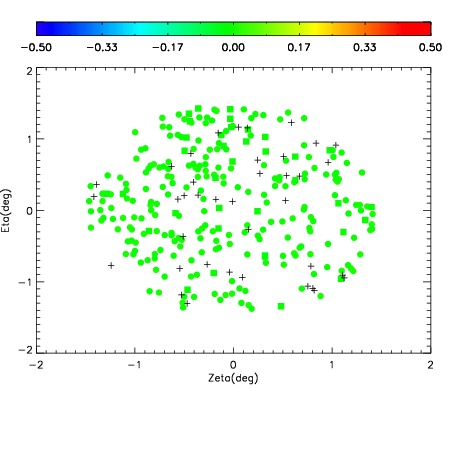
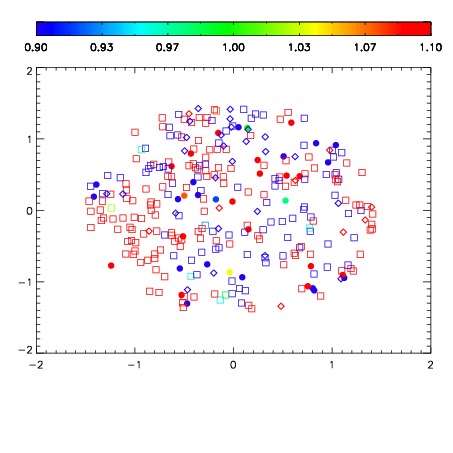
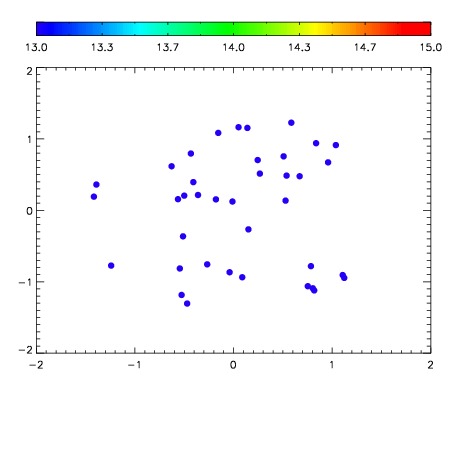

| Frame | Nreads | Zeropoints | Mag plots | Spatial mag deviation | Spatial sky 16325A emission deviations (filled: sky, open: star) | Spatial sky continuum emission | Spatial sky telluric CO2 absorption deviations (filled: H < 10) | |||||||||||||||||||||||
| 0 | 0 |
|
|
|
|
|
|
| IPAIR | NAME | SHIFT | NEWSHIFT | S/N | NAME | SHIFT | NEWSHIFT | S/N |
| 0 | 06060027 | 0.480812 | 0.00000 | 19.1846 | 06060028 | -0.00137062 | 0.482183 | 19.2118 |
| 1 | 06060030 | 0.478847 | 0.00196502 | 19.1805 | 06060032 | 0.00368662 | 0.477125 | 19.1732 |
| 2 | 06060026 | 0.479640 | 0.00117201 | 19.1689 | 06060029 | 0.00595200 | 0.474860 | 19.1451 |
| 3 | 06060031 | 0.479589 | 0.00122303 | 19.1561 | 06060025 | 0.00000 | 0.480812 | 19.1423 |