| Frame | Nreads | Zeropoints | Mag plots
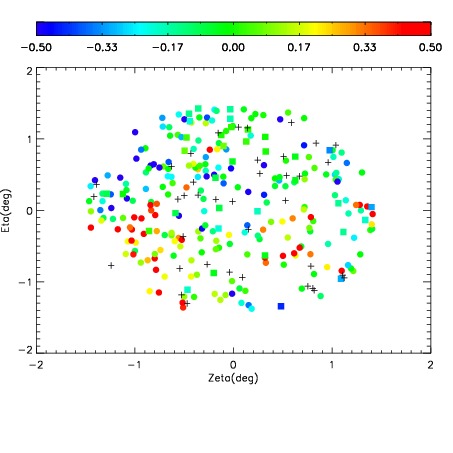
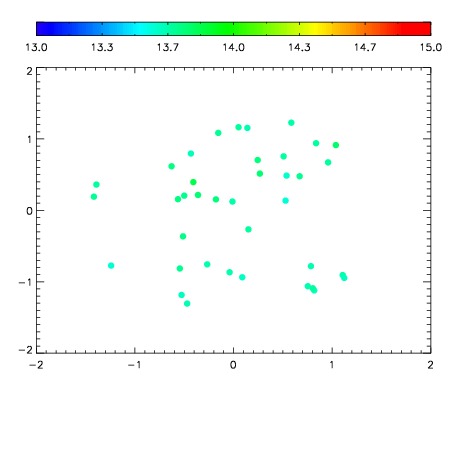
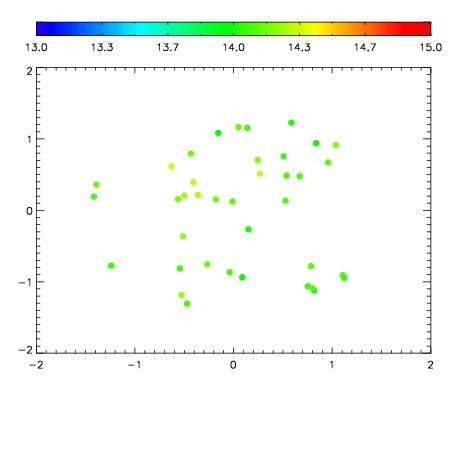
| Spatial mag deviation
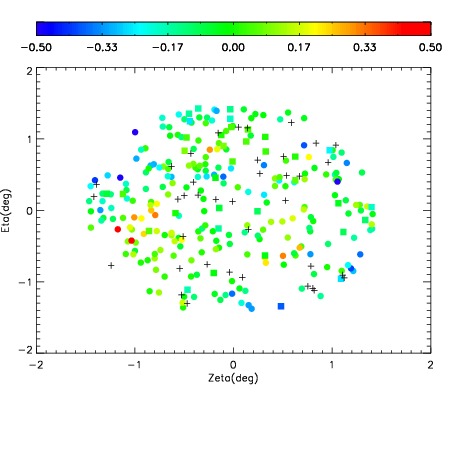
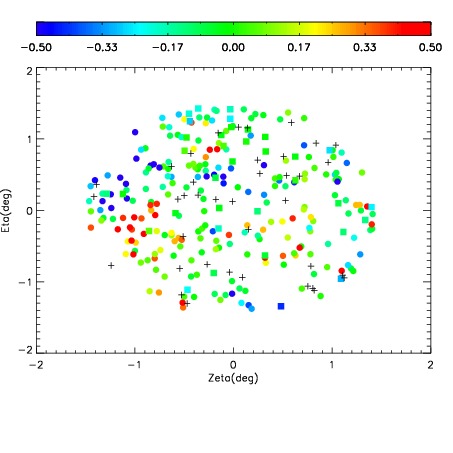
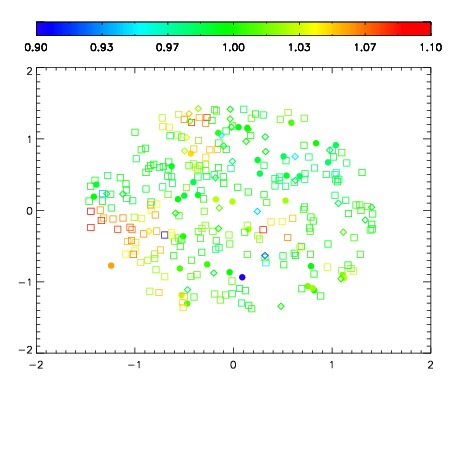
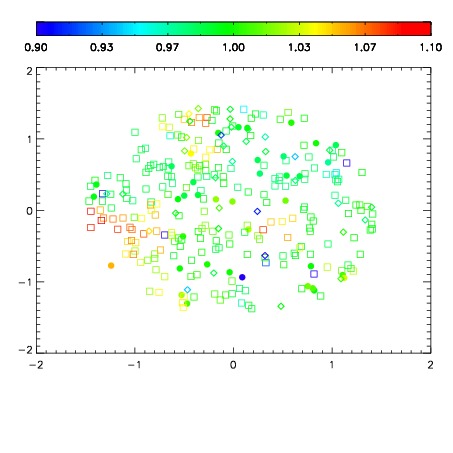
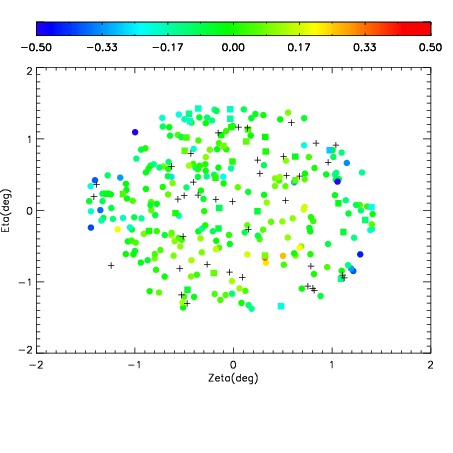
| Spatial sky 16325A emission deviations (filled: sky, open: star)
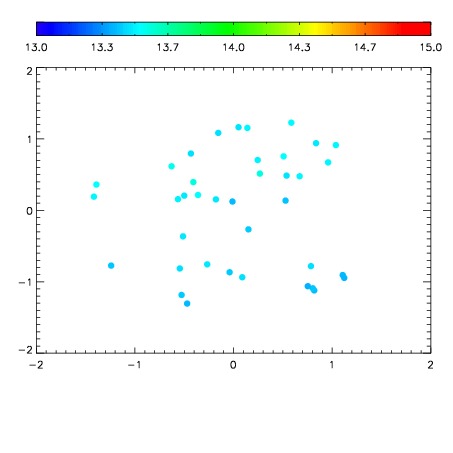
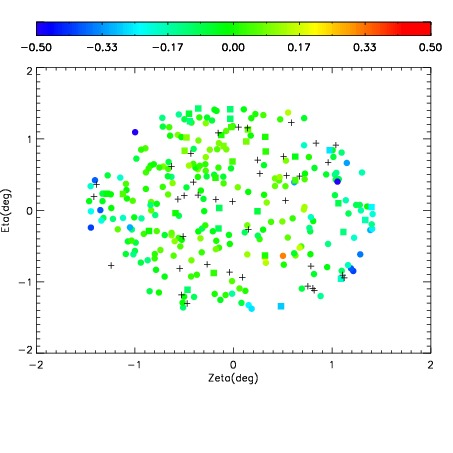
| Spatial sky continuum emission
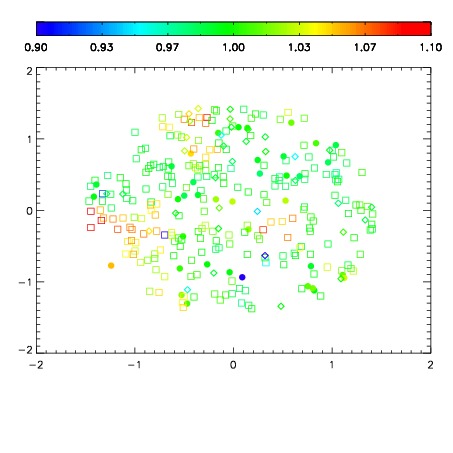
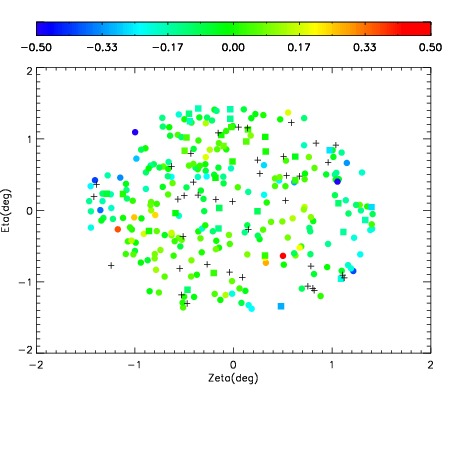
| Spatial sky telluric CO2 absorption deviations (filled: H < 10)
|
| 6620021
| 47
| | Red | Green | Blue
| | z | | 17.53
| | znorm | | 13.35
| | sky | 13.8 | 13.7 | 13.9
| | S/N | 4.8 | 8.5 | 9.5
| | S/N(c) | 9.0 | 8.0 | 4.1
| | SN(E/C) 1.02
|
| 
| 
| 
| 
| 
|
| 6620022
| 47
| | Red | Green | Blue
| | z | | 16.51
| | znorm | | 12.33
| | sky | 13.6 | 13.5 | 13.8
| | S/N | 1.6 | 4.0 | 4.6
| | S/N(c) | 3.9 | 4.0 | 2.0
| | SN(E/C) 1.02
|
| 
| 
| 
| 
| 
|
| 6620023
| 47
| | Red | Green | Blue
| | z | | 16.11
| | znorm | | 11.93
| | sky | 13.6 | 13.5 | 13.7
| | S/N | 1.4 | 3.0 | 3.6
| | S/N(c) | 2.8 | 3.1 | 1.6
| | SN(E/C) 1.05
|
| 
| 
| 
| 
| 
|
| 6620024
| 47
| | Red | Green | Blue
| | z | | 17.16
| | znorm | | 12.98
| | sky | 13.7 | 13.6 | 13.9
| | S/N | 3.4 | 6.6 | 7.3
| | S/N(c) | 6.9 | 6.5 | 3.3
| | SN(E/C) 1.01
|
| 
| 
| 
| 
| 
|
| 6620025
| 47
| | Red | Green | Blue
| | z | | 17.30
| | znorm | | 13.12
| | sky | 13.8 | 13.7 | 13.9
| | S/N | 3.7 | 7.2 | 7.9
| | S/N(c) | 7.5 | 7.0 | 3.7
| | SN(E/C) 0.98
|
| 
| 
| 
| 
| 
|
| 6620026
| 47
| | Red | Green | Blue
| | z | | 17.85
| | znorm | | 13.67
| | sky | 13.8 | 13.8 | 14.1
| | S/N | 6.0 | 11.0 | 11.8
| | S/N(c) | 11.6 | 10.1 | 5.2
| | SN(E/C) 1.02
|
| 
| 
| 
| 
| 
|
| 6620027
| 47
| | Red | Green | Blue
| | z | | 18.49
| | znorm | | 14.31
| | sky | 14.2 | 14.1 | 14.3
| | S/N | 10.2 | 17.0 | 18.4
| | S/N(c) | 17.5 | 14.3 | 7.5
| | SN(E/C) 0.94
|
| 
| 
| 
| 
| 
|
| 6620028
| 47
| | Red | Green | Blue
| | z | | 18.22
| | znorm | | 14.04
| | sky | 14.1 | 14.1 | 14.2
| | S/N | 8.3 | 14.6 | 15.5
| | S/N(c) | 14.7 | 12.4 | 6.4
| | SN(E/C) 0.98
|
| 
| 
| 
| 
| 
|