| Red | Green | Blue | |
| z | 17.65 | ||
| znorm | Inf | ||
| sky | -Inf | -Inf | -Inf |
| S/N | 9.9 | 18.4 | 19.9 |
| S/N(c) | 0.0 | 0.0 | 0.0 |
| SN(E/C) |
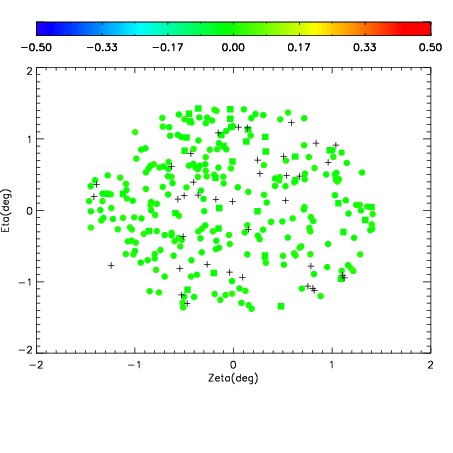
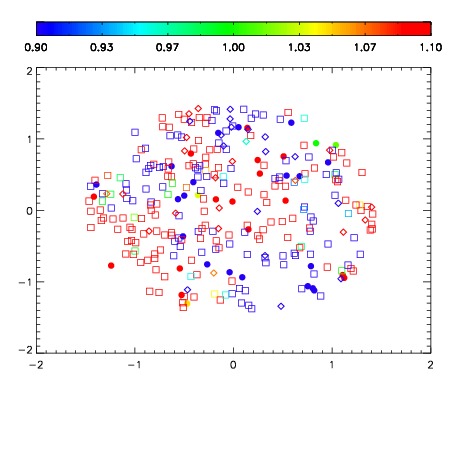
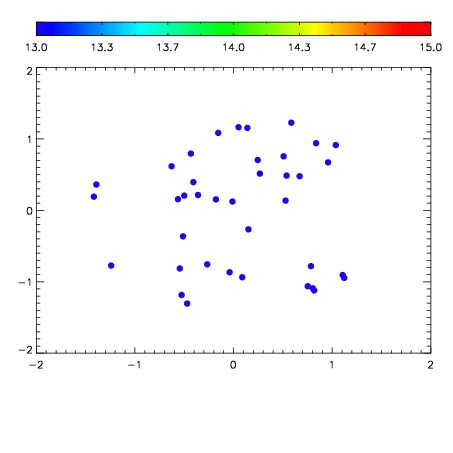

| Frame | Nreads | Zeropoints | Mag plots | Spatial mag deviation | Spatial sky 16325A emission deviations (filled: sky, open: star) | Spatial sky continuum emission | Spatial sky telluric CO2 absorption deviations (filled: H < 10) | |||||||||||||||||||||||
| 0 | 0 |
|
|
|
|
|
|
| IPAIR | NAME | SHIFT | NEWSHIFT | S/N | NAME | SHIFT | NEWSHIFT | S/N |
| 0 | 06620027 | 0.478540 | 0.00000 | 18.4890 | 06620028 | 0.000180343 | 0.478360 | 18.2228 |
| 1 | 06620026 | 0.478410 | 0.000129998 | 17.8539 | 06620021 | 0.00000 | 0.478540 | 17.5388 |
| 2 | 06620022 | 0.477627 | 0.000912994 | 16.5175 | 06620025 | -0.000679810 | 0.479220 | 17.3097 |
| 3 | 06620023 | 0.478480 | 5.99921e-05 | 16.1224 | 06620024 | 0.000253728 | 0.478286 | 17.1676 |