| Red | Green | Blue | |
| z | 17.64 | ||
| znorm | Inf | ||
| sky | -Inf | -NaN | -NaN |
| S/N | 23.7 | 42.1 | 44.5 |
| S/N(c) | 0.0 | 0.0 | 0.0 |
| SN(E/C) |
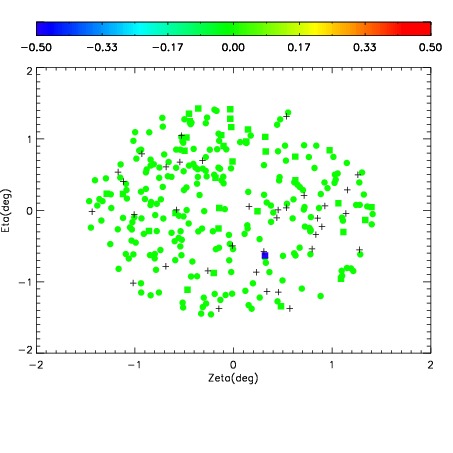
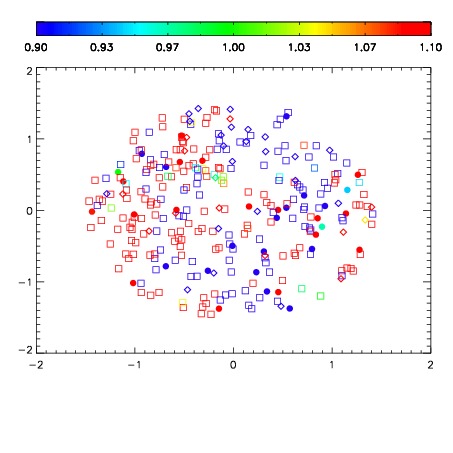


| Frame | Nreads | Zeropoints | Mag plots | Spatial mag deviation | Spatial sky 16325A emission deviations (filled: sky, open: star) | Spatial sky continuum emission | Spatial sky telluric CO2 absorption deviations (filled: H < 10) | |||||||||||||||||||||||
| 0 | 0 |
|
|
|
|
|
|
| IPAIR | NAME | SHIFT | NEWSHIFT | S/N | NAME | SHIFT | NEWSHIFT | S/N |
| 0 | 02780046 | 0.420592 | 0.00000 | 19.1467 | 02780044 | -0.00211981 | 0.422712 | 19.1047 |
| 1 | 02780045 | 0.418194 | 0.00239801 | 19.1366 | 02780047 | 0.00695518 | 0.413637 | 18.8564 |
| 2 | 02780041 | 0.418238 | 0.00235400 | 18.8901 | 02780043 | 0.00777236 | 0.412820 | 18.8209 |
| 3 | 02780042 | 0.420305 | 0.000286996 | 18.8484 | 02780040 | 0.00000 | 0.420592 | 18.7027 |