| Red | Green | Blue | |
| z | 17.63 | ||
| znorm | Inf | ||
| sky | -NaN | -NaN | -Inf |
| S/N | 22.2 | 39.0 | 40.4 |
| S/N(c) | 0.0 | 0.0 | 0.0 |
| SN(E/C) |
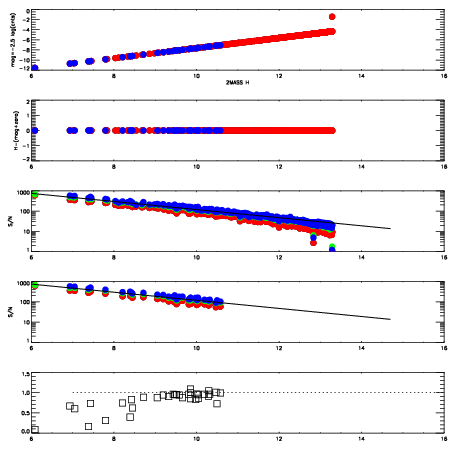


| Frame | Nreads | Zeropoints | Mag plots | Spatial mag deviation | Spatial sky 16325A emission deviations (filled: sky, open: star) | Spatial sky continuum emission | Spatial sky telluric CO2 absorption deviations (filled: H < 10) | |||||||||||||||||||||||
| 0 | 0 |
|
|
|
|
|
|
| IPAIR | NAME | SHIFT | NEWSHIFT | S/N | NAME | SHIFT | NEWSHIFT | S/N |
| 0 | 06630021 | 0.476138 | 0.00000 | 18.8327 | 06630019 | -0.00323066 | 0.479369 | 18.8244 |
| 1 | 06630020 | 0.476089 | 4.89950e-05 | 18.8619 | 06630022 | -0.00342003 | 0.479558 | 18.8535 |
| 2 | 06630016 | 0.475718 | 0.000420004 | 18.8289 | 06630018 | -0.00164649 | 0.477784 | 18.7387 |
| 3 | 06630017 | 0.475884 | 0.000254005 | 18.7652 | 06630015 | 0.00000 | 0.476138 | 18.5773 |