| Red | Green | Blue | |
| z | 17.63 | ||
| znorm | Inf | ||
| sky | -NaN | -NaN | -Inf |
| S/N | 29.0 | 47.4 | 53.0 |
| S/N(c) | 0.0 | 0.0 | 0.0 |
| SN(E/C) |


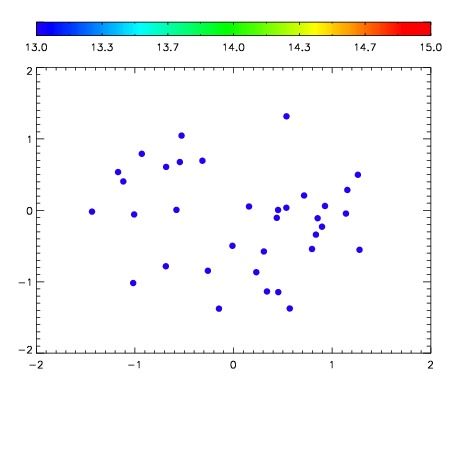

| Frame | Nreads | Zeropoints | Mag plots | Spatial mag deviation | Spatial sky 16325A emission deviations (filled: sky, open: star) | Spatial sky continuum emission | Spatial sky telluric CO2 absorption deviations (filled: H < 10) | |||||||||||||||||||||||
| 0 | 0 |
|
|
|
|
|
|
| IPAIR | NAME | SHIFT | NEWSHIFT | S/N | NAME | SHIFT | NEWSHIFT | S/N |
| 0 | 06670028 | 0.476049 | 0.00000 | 19.1173 | 06670033 | 0.00318382 | 0.472865 | 19.1003 |
| 1 | 06670031 | 0.475640 | 0.000409007 | 19.0933 | 06670030 | 0.000922951 | 0.475126 | 19.0991 |
| 2 | 06670032 | 0.475742 | 0.000306994 | 19.0902 | 06670026 | 0.00000 | 0.476049 | 19.0544 |
| 3 | 06670027 | 0.475300 | 0.000748992 | 19.0711 | 06670029 | 0.00309524 | 0.472954 | 19.0023 |