| Red | Green | Blue | |
| z | 17.63 | ||
| znorm | Inf | ||
| sky | -NaN | -NaN | -Inf |
| S/N | 27.4 | 43.7 | 50.1 |
| S/N(c) | 0.0 | 0.0 | 0.0 |
| SN(E/C) |
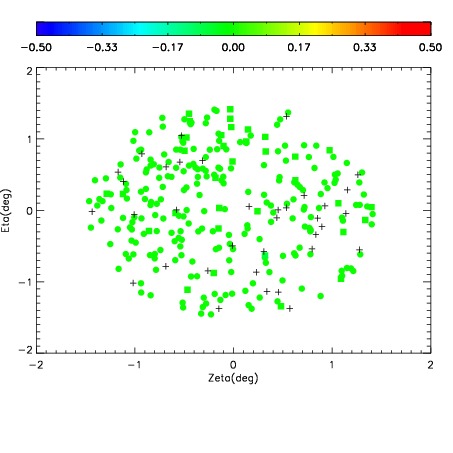

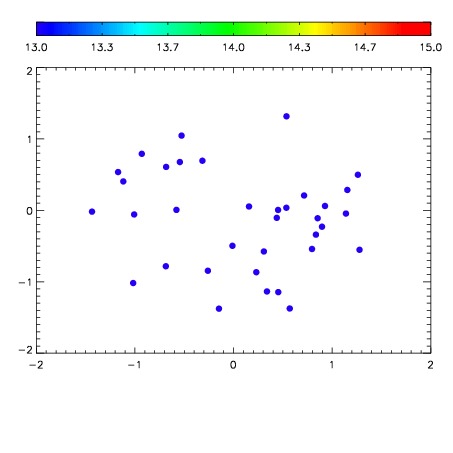

| Frame | Nreads | Zeropoints | Mag plots | Spatial mag deviation | Spatial sky 16325A emission deviations (filled: sky, open: star) | Spatial sky continuum emission | Spatial sky telluric CO2 absorption deviations (filled: H < 10) | |||||||||||||||||||||||
| 0 | 0 |
|
|
|
|
|
|
| IPAIR | NAME | SHIFT | NEWSHIFT | S/N | NAME | SHIFT | NEWSHIFT | S/N |
| 0 | 06900013 | 0.492840 | 0.00000 | 18.9510 | 06900015 | -0.000628104 | 0.493468 | 18.8888 |
| 1 | 06900017 | 0.492072 | 0.000768006 | 19.1239 | 06900011 | 0.00000 | 0.492840 | 19.1018 |
| 2 | 06900012 | 0.492030 | 0.000809997 | 19.0962 | 06900014 | 0.000284551 | 0.492555 | 19.0397 |
| 3 | 06900016 | 0.492206 | 0.000633985 | 19.0792 | 06900018 | -0.000447514 | 0.493288 | 18.9964 |