| Red | Green | Blue | |
| z | 17.64 | ||
| znorm | Inf | ||
| sky | -NaN | -Inf | -Inf |
| S/N | 29.4 | 46.8 | 50.1 |
| S/N(c) | 0.0 | 0.0 | 0.0 |
| SN(E/C) |
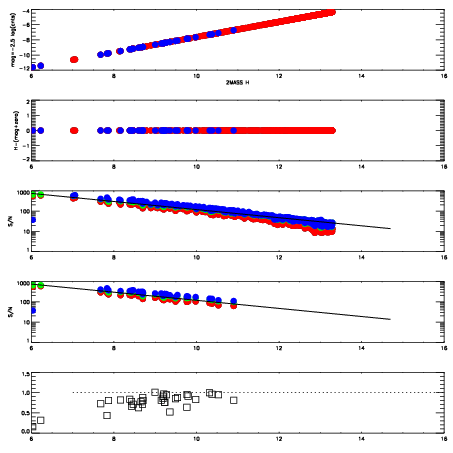

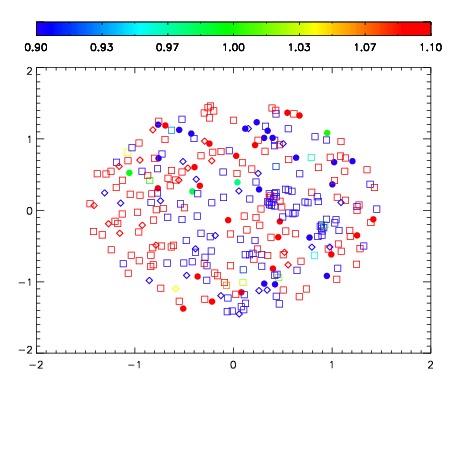
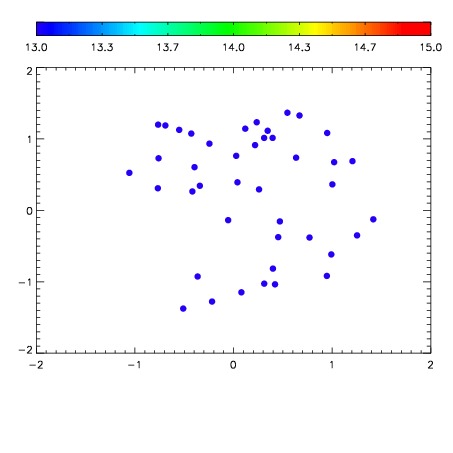

| Frame | Nreads | Zeropoints | Mag plots | Spatial mag deviation | Spatial sky 16325A emission deviations (filled: sky, open: star) | Spatial sky continuum emission | Spatial sky telluric CO2 absorption deviations (filled: H < 10) | |||||||||||||||||||||||
| 0 | 0 |
|
|
|
|
|
|
| IPAIR | NAME | SHIFT | NEWSHIFT | S/N | NAME | SHIFT | NEWSHIFT | S/N |
| 0 | 06430016 | 0.485326 | 0.00000 | 19.0741 | 06430010 | 0.00000 | 0.485326 | 19.0741 |
| 1 | 06430015 | 0.485014 | 0.000312001 | 19.0844 | 06430014 | -0.000794125 | 0.486120 | 19.0834 |
| 2 | 06430011 | 0.483086 | 0.00224000 | 19.0575 | 06430017 | 0.00225854 | 0.483067 | 19.0705 |
| 3 | 06430012 | 0.483718 | 0.00160798 | 19.0443 | 06430013 | 0.000198589 | 0.485127 | 19.0015 |