| Red | Green | Blue | |
| z | 17.64 | ||
| znorm | Inf | ||
| sky | -Inf | -Inf | -Inf |
| S/N | 29.9 | 48.7 | 51.2 |
| S/N(c) | 0.0 | 0.0 | 0.0 |
| SN(E/C) |

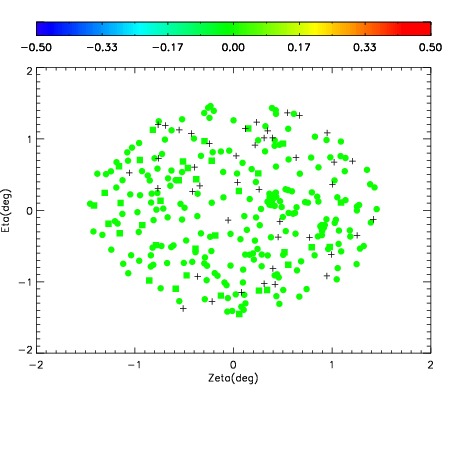
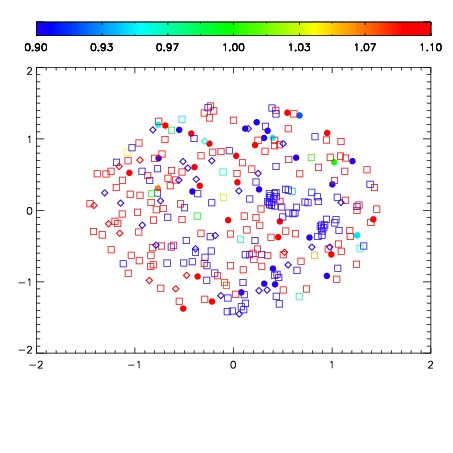


| Frame | Nreads | Zeropoints | Mag plots | Spatial mag deviation | Spatial sky 16325A emission deviations (filled: sky, open: star) | Spatial sky continuum emission | Spatial sky telluric CO2 absorption deviations (filled: H < 10) | |||||||||||||||||||||||
| 0 | 0 |
|
|
|
|
|
|
| IPAIR | NAME | SHIFT | NEWSHIFT | S/N | NAME | SHIFT | NEWSHIFT | S/N |
| 0 | 06590031 | 0.473305 | 0.00000 | 19.0613 | 06590032 | 0.00579980 | 0.467505 | 19.0104 |
| 1 | 06590027 | 0.471513 | 0.00179198 | 19.1450 | 06590025 | 0.00000 | 0.473305 | 19.1333 |
| 2 | 06590026 | 0.470957 | 0.00234798 | 19.1313 | 06590028 | 0.00388751 | 0.469417 | 19.1204 |
| 3 | 06590030 | 0.472981 | 0.000323981 | 19.0921 | 06590029 | 0.00248662 | 0.470818 | 19.1104 |