| Red | Green | Blue | |
| z | 17.63 | ||
| znorm | Inf | ||
| sky | -NaN | -NaN | -Inf |
| S/N | 30.4 | 48.6 | 49.9 |
| S/N(c) | 0.0 | 0.0 | 0.0 |
| SN(E/C) |
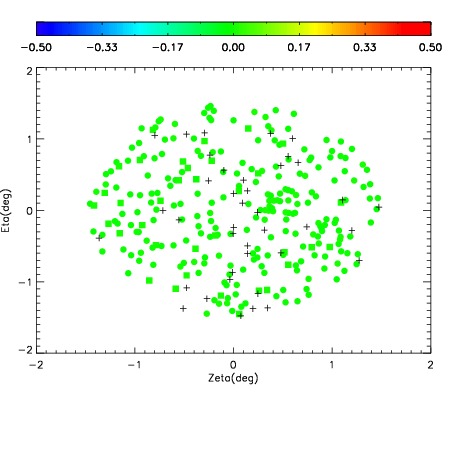
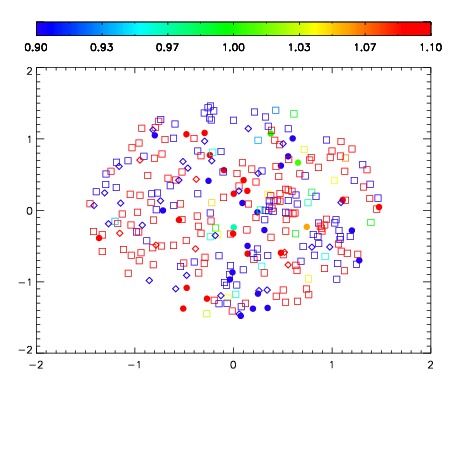


| Frame | Nreads | Zeropoints | Mag plots | Spatial mag deviation | Spatial sky 16325A emission deviations (filled: sky, open: star) | Spatial sky continuum emission | Spatial sky telluric CO2 absorption deviations (filled: H < 10) | |||||||||||||||||||||||
| 0 | 0 |
|
|
|
|
|
|
| IPAIR | NAME | SHIFT | NEWSHIFT | S/N | NAME | SHIFT | NEWSHIFT | S/N |
| 0 | 06610030 | 0.470742 | 0.00000 | 19.1179 | 06610032 | -0.00549542 | 0.476237 | 19.1275 |
| 1 | 06610026 | 0.465525 | 0.00521699 | 19.1753 | 06610025 | 0.00000 | 0.470742 | 19.1847 |
| 2 | 06610031 | 0.470150 | 0.000591993 | 19.1579 | 06610028 | -0.00446320 | 0.475205 | 19.1635 |
| 3 | 06610027 | 0.465603 | 0.00513899 | 19.1549 | 06610029 | -0.00522110 | 0.475963 | 19.1346 |