| Red | Green | Blue | |
| z | 17.63 | ||
| znorm | Inf | ||
| sky | -NaN | -NaN | -Inf |
| S/N | 17.9 | 31.1 | 32.4 |
| S/N(c) | 0.0 | 0.0 | 0.0 |
| SN(E/C) |
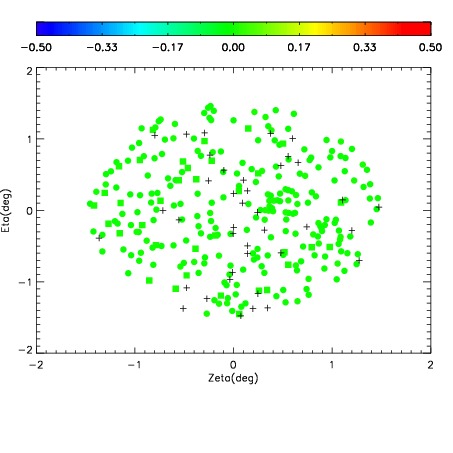
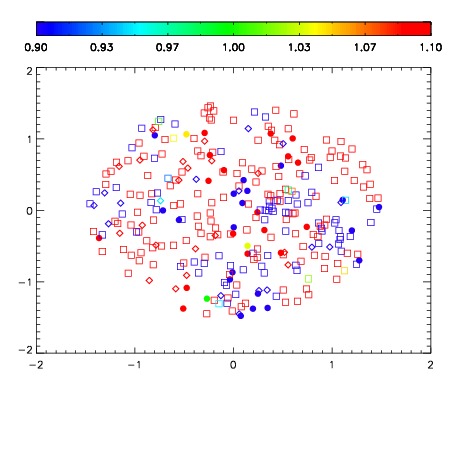
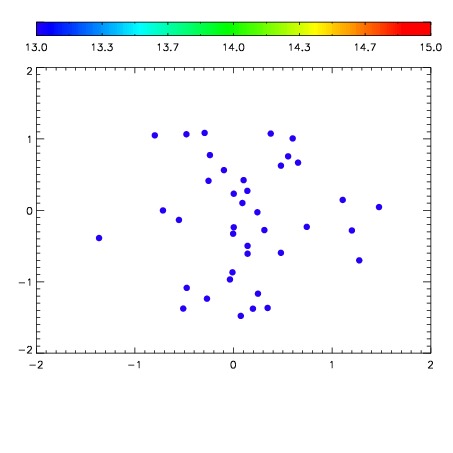

| Frame | Nreads | Zeropoints | Mag plots | Spatial mag deviation | Spatial sky 16325A emission deviations (filled: sky, open: star) | Spatial sky continuum emission | Spatial sky telluric CO2 absorption deviations (filled: H < 10) | |||||||||||||||||||||||
| 0 | 0 |
|
|
|
|
|
|
| IPAIR | NAME | SHIFT | NEWSHIFT | S/N | NAME | SHIFT | NEWSHIFT | S/N |
| 0 | 06650028 | 0.488506 | 0.00000 | 18.5230 | 06650029 | 0.00608326 | 0.482423 | 18.3928 |
| 1 | 06650027 | 0.488334 | 0.000171989 | 18.5786 | 06650026 | 0.00000 | 0.488506 | 18.6821 |
| 2 | 06650031 | 0.487369 | 0.00113699 | 18.4699 | 06650030 | 0.00610654 | 0.482399 | 18.3620 |
| 3 | 06650032 | 0.488393 | 0.000112981 | 18.0418 | 06650033 | 0.00365477 | 0.484851 | 18.1984 |