| Red | Green | Blue | |
| z | 17.64 | ||
| znorm | Inf | ||
| sky | -Inf | -Inf | -Inf |
| S/N | 17.2 | 31.1 | 32.2 |
| S/N(c) | 0.0 | 0.0 | 0.0 |
| SN(E/C) |
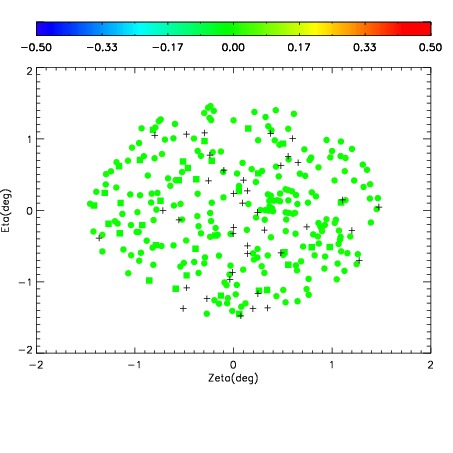
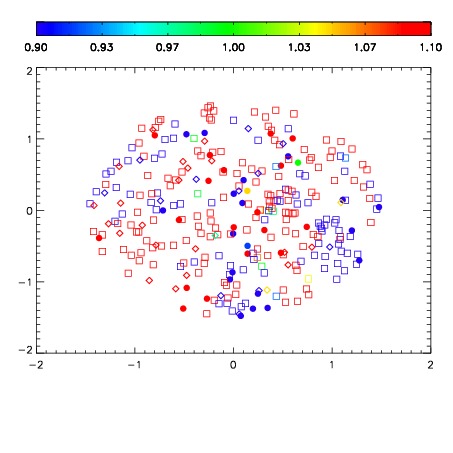
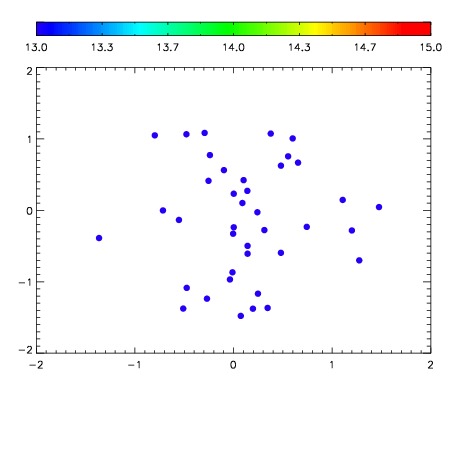

| Frame | Nreads | Zeropoints | Mag plots | Spatial mag deviation | Spatial sky 16325A emission deviations (filled: sky, open: star) | Spatial sky continuum emission | Spatial sky telluric CO2 absorption deviations (filled: H < 10) | |||||||||||||||||||||||
| 0 | 0 |
|
|
|
|
|
|
| IPAIR | NAME | SHIFT | NEWSHIFT | S/N | NAME | SHIFT | NEWSHIFT | S/N |
| 0 | 06890017 | 0.499062 | 0.00000 | 18.4631 | 06890014 | 0.00159161 | 0.497470 | 18.3726 |
| 1 | 06890013 | 0.495996 | 0.00306600 | 18.7676 | 06890018 | 0.00259409 | 0.496468 | 18.4894 |
| 2 | 06890016 | 0.497741 | 0.00132099 | 18.5362 | 06890011 | 0.00000 | 0.499062 | 18.3839 |
| 3 | 06890012 | 0.495659 | 0.00340301 | 18.3998 | 06890015 | -0.000171105 | 0.499233 | 18.3722 |