| Red | Green | Blue | |
| z | 17.64 | ||
| znorm | Inf | ||
| sky | -NaN | -Inf | -Inf |
| S/N | 22.6 | 39.4 | 42.6 |
| S/N(c) | 0.0 | 0.0 | 0.0 |
| SN(E/C) |
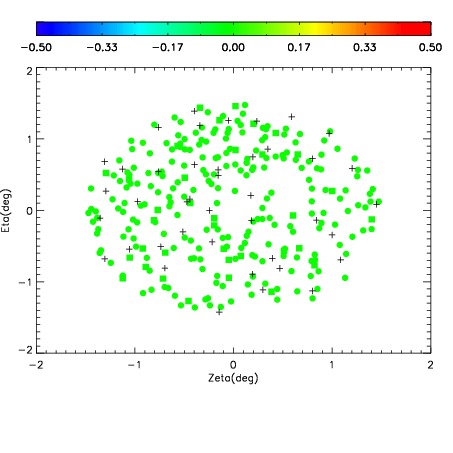
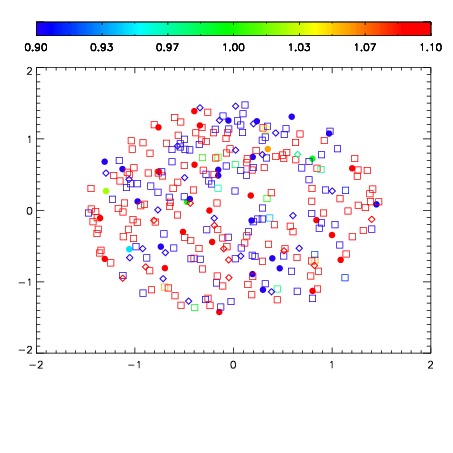
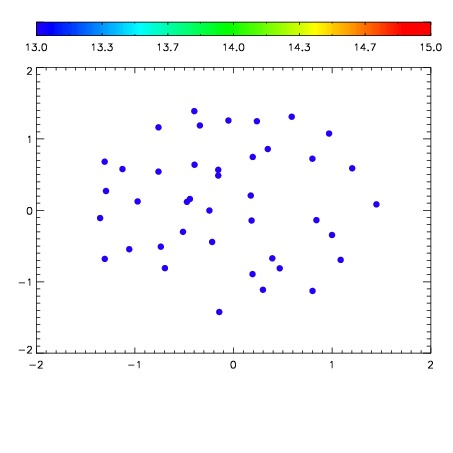

| Frame | Nreads | Zeropoints | Mag plots | Spatial mag deviation | Spatial sky 16325A emission deviations (filled: sky, open: star) | Spatial sky continuum emission | Spatial sky telluric CO2 absorption deviations (filled: H < 10) | |||||||||||||||||||||||
| 0 | 0 |
|
|
|
|
|
|
| IPAIR | NAME | SHIFT | NEWSHIFT | S/N | NAME | SHIFT | NEWSHIFT | S/N |
| 0 | 06080049 | 0.481821 | 0.00000 | 18.8682 | 06080050 | -0.00117616 | 0.482997 | 18.7852 |
| 1 | 06080052 | 0.480037 | 0.00178400 | 18.8828 | 06080051 | -0.00543142 | 0.487252 | 18.8987 |
| 2 | 06080048 | 0.481785 | 3.60012e-05 | 18.8009 | 06080047 | 0.00000 | 0.481821 | 18.7697 |
| 3 | 06080053 | 0.480782 | 0.00103900 | 18.7505 | 06080054 | -0.00309477 | 0.484916 | 18.5826 |