| Red | Green | Blue | |
| z | 17.64 | ||
| znorm | Inf | ||
| sky | -NaN | -NaN | -Inf |
| S/N | 31.3 | 54.4 | 57.2 |
| S/N(c) | 0.0 | 0.0 | 0.0 |
| SN(E/C) |
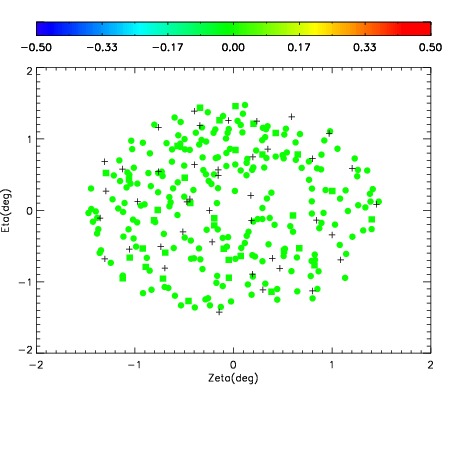
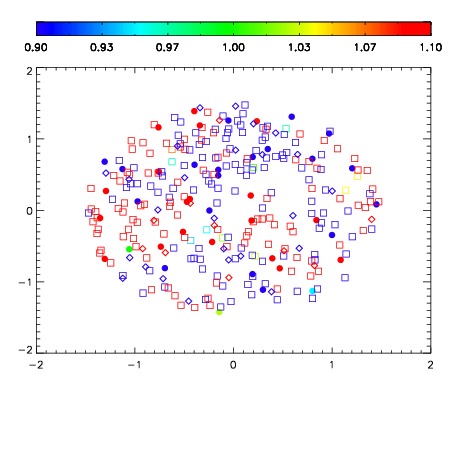
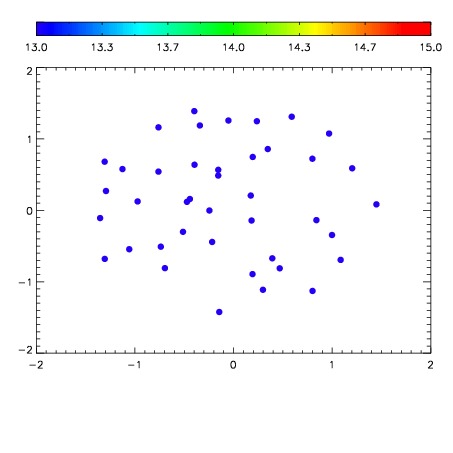

| Frame | Nreads | Zeropoints | Mag plots | Spatial mag deviation | Spatial sky 16325A emission deviations (filled: sky, open: star) | Spatial sky continuum emission | Spatial sky telluric CO2 absorption deviations (filled: H < 10) | |||||||||||||||||||||||
| 0 | 0 |
|
|
|
|
|
|
| IPAIR | NAME | SHIFT | NEWSHIFT | S/N | NAME | SHIFT | NEWSHIFT | S/N |
| 0 | 06310043 | 0.472977 | 0.00000 | 19.0153 | 06310044 | -0.00383257 | 0.476810 | 18.9503 |
| 1 | 06310038 | 0.472601 | 0.000376016 | 19.1105 | 06310037 | 0.00000 | 0.472977 | 19.0939 |
| 2 | 06310039 | 0.472805 | 0.000172019 | 19.0582 | 06310040 | -0.000711894 | 0.473689 | 19.0284 |
| 3 | 06310042 | 0.472381 | 0.000596017 | 19.0535 | 06310041 | -0.00347993 | 0.476457 | 19.0111 |
| 4 | 06310046 | 0.471427 | 0.00155002 | 18.9083 | 06310048 | -0.000373181 | 0.473350 | 18.9342 |
| 5 | 06310047 | 0.472279 | 0.000698000 | 18.8939 | 06310045 | -0.00159449 | 0.474571 | 18.8053 |