| Red | Green | Blue | |
| z | 17.64 | ||
| znorm | Inf | ||
| sky | -Inf | -Inf | -Inf |
| S/N | 27.6 | 45.7 | 48.8 |
| S/N(c) | 0.0 | 0.0 | 0.0 |
| SN(E/C) |

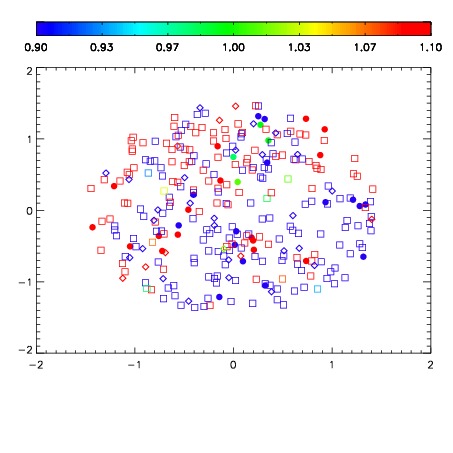
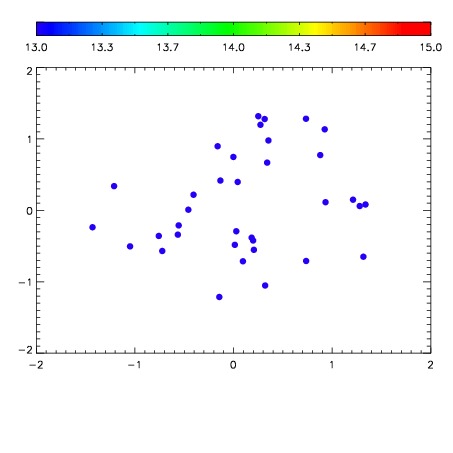

| Frame | Nreads | Zeropoints | Mag plots | Spatial mag deviation | Spatial sky 16325A emission deviations (filled: sky, open: star) | Spatial sky continuum emission | Spatial sky telluric CO2 absorption deviations (filled: H < 10) | |||||||||||||||||||||||
| 0 | 0 |
|
|
|
|
|
|
| IPAIR | NAME | SHIFT | NEWSHIFT | S/N | NAME | SHIFT | NEWSHIFT | S/N |
| 0 | 03070025 | 0.500677 | 0.00000 | 19.1314 | 03070026 | 0.00131061 | 0.499366 | 19.1257 |
| 1 | 03070024 | 0.499870 | 0.000806987 | 19.1663 | 03070027 | 0.000898646 | 0.499778 | 19.1803 |
| 2 | 03070028 | 0.500340 | 0.000337005 | 19.0638 | 03070023 | 0.00000 | 0.500677 | 19.1134 |
| 3 | 03070029 | 0.500555 | 0.000122011 | 19.0504 | 03070030 | 0.00287475 | 0.497802 | 19.0125 |