| Red | Green | Blue | |
| z | 17.64 | ||
| znorm | Inf | ||
| sky | -NaN | -NaN | -Inf |
| S/N | 23.7 | 41.1 | 43.3 |
| S/N(c) | 0.0 | 0.0 | 0.0 |
| SN(E/C) |


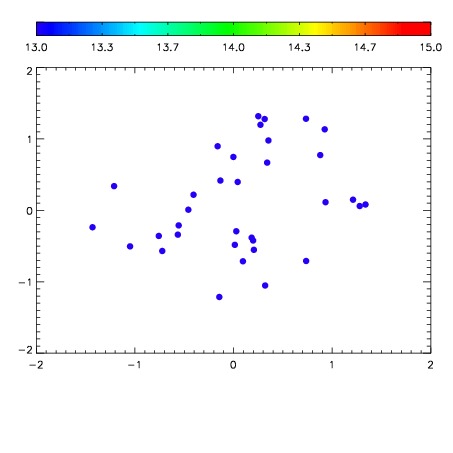

| Frame | Nreads | Zeropoints | Mag plots | Spatial mag deviation | Spatial sky 16325A emission deviations (filled: sky, open: star) | Spatial sky continuum emission | Spatial sky telluric CO2 absorption deviations (filled: H < 10) | |||||||||||||||||||||||
| 0 | 0 |
|
|
|
|
|
|
| IPAIR | NAME | SHIFT | NEWSHIFT | S/N | NAME | SHIFT | NEWSHIFT | S/N |
| 0 | 06090048 | 0.483493 | 0.00000 | 18.8614 | 06090047 | 0.00000 | 0.483493 | 18.8746 |
| 1 | 06090049 | 0.483035 | 0.000458002 | 19.0199 | 06090050 | 0.000173866 | 0.483319 | 18.9944 |
| 2 | 06090053 | 0.482212 | 0.00128099 | 18.9810 | 06090051 | -0.000641551 | 0.484135 | 18.9478 |
| 3 | 06090052 | 0.482166 | 0.00132701 | 18.9650 | 06090054 | -0.000440796 | 0.483934 | 18.9020 |