| Red | Green | Blue | |
| z | 17.64 | ||
| znorm | Inf | ||
| sky | -Inf | -Inf | -Inf |
| S/N | 20.7 | 36.1 | 37.3 |
| S/N(c) | 0.0 | 0.0 | 0.0 |
| SN(E/C) |
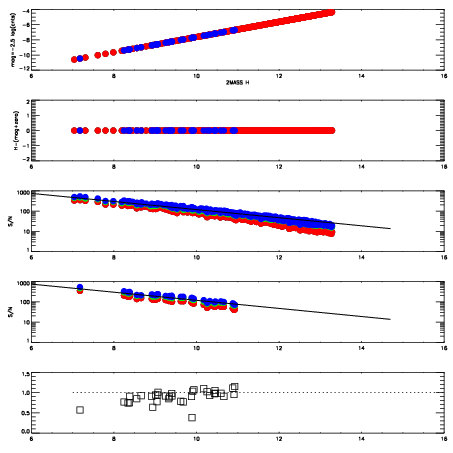
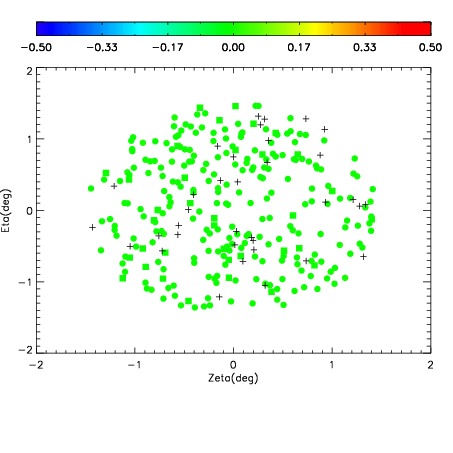
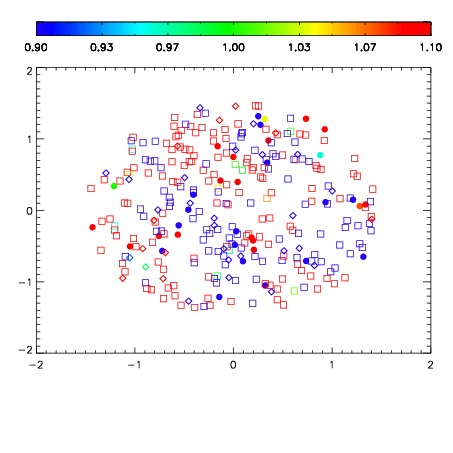


| Frame | Nreads | Zeropoints | Mag plots | Spatial mag deviation | Spatial sky 16325A emission deviations (filled: sky, open: star) | Spatial sky continuum emission | Spatial sky telluric CO2 absorption deviations (filled: H < 10) | |||||||||||||||||||||||
| 0 | 0 |
|
|
|
|
|
|
| IPAIR | NAME | SHIFT | NEWSHIFT | S/N | NAME | SHIFT | NEWSHIFT | S/N |
| 0 | 06420035 | 0.489092 | 0.00000 | 18.7112 | 06420033 | 0.00000 | 0.489092 | 18.6670 |
| 1 | 06420039 | 0.485888 | 0.00320399 | 18.9283 | 06420037 | 0.00221461 | 0.486877 | 18.7412 |
| 2 | 06420038 | 0.485586 | 0.00350600 | 18.8849 | 06420040 | 0.00404455 | 0.485047 | 18.6707 |
| 3 | 06420034 | 0.488251 | 0.000840992 | 18.6807 | 06420036 | 0.00238101 | 0.486711 | 18.6241 |