| Red | Green | Blue | |
| z | 17.64 | ||
| znorm | Inf | ||
| sky | -Inf | -Inf | -Inf |
| S/N | 23.5 | 41.2 | 43.7 |
| S/N(c) | 0.0 | 0.0 | 0.0 |
| SN(E/C) |
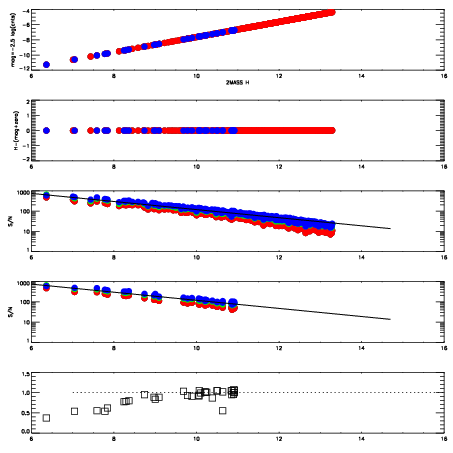

| Frame | Nreads | Zeropoints | Mag plots | Spatial mag deviation | Spatial sky 16325A emission deviations (filled: sky, open: star) | Spatial sky continuum emission | Spatial sky telluric CO2 absorption deviations (filled: H < 10) | |||||||||||||||||||||||
| 0 | 0 |
|
|
|
|
|
|
| IPAIR | NAME | SHIFT | NEWSHIFT | S/N | NAME | SHIFT | NEWSHIFT | S/N |
| 0 | 05480049 | 0.487816 | 0.00000 | 18.8767 | 05480051 | -0.000737094 | 0.488553 | 18.7085 |
| 1 | 05480052 | 0.486911 | 0.000905007 | 18.9720 | 05480054 | -0.00152779 | 0.489344 | 18.8426 |
| 2 | 05480053 | 0.485894 | 0.00192201 | 18.9141 | 05480047 | 0.00000 | 0.487816 | 18.8422 |
| 3 | 05480048 | 0.487488 | 0.000328004 | 18.8047 | 05480050 | -0.00244839 | 0.490264 | 18.3654 |