| Red | Green | Blue | |
| z | 17.64 | ||
| znorm | Inf | ||
| sky | -Inf | -Inf | -Inf |
| S/N | 26.5 | 43.6 | 47.1 |
| S/N(c) | 0.0 | 0.0 | 0.0 |
| SN(E/C) |
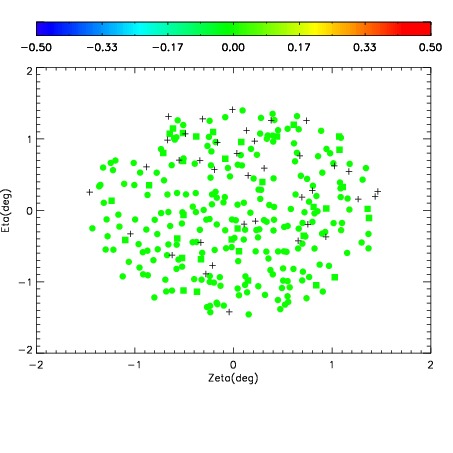
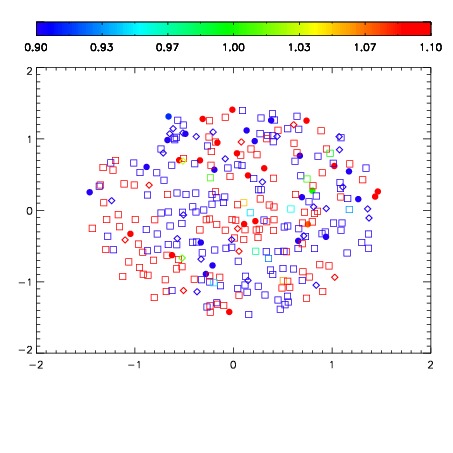
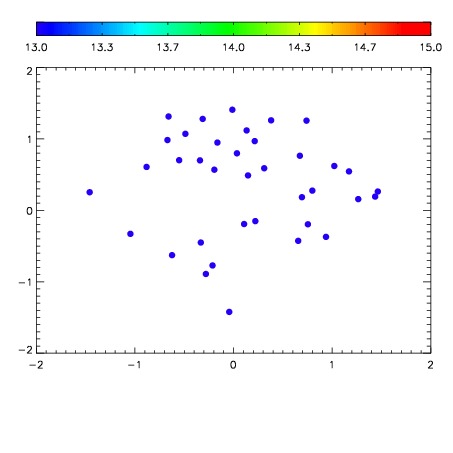

| Frame | Nreads | Zeropoints | Mag plots | Spatial mag deviation | Spatial sky 16325A emission deviations (filled: sky, open: star) | Spatial sky continuum emission | Spatial sky telluric CO2 absorption deviations (filled: H < 10) | |||||||||||||||||||||||
| 0 | 0 |
|
|
|
|
|
|
| IPAIR | NAME | SHIFT | NEWSHIFT | S/N | NAME | SHIFT | NEWSHIFT | S/N |
| 0 | 06090037 | 0.483946 | 0.00000 | 18.9923 | 06090043 | -0.00113401 | 0.485080 | 18.9901 |
| 1 | 06090038 | 0.483785 | 0.000160992 | 19.0582 | 06090040 | -3.53827e-05 | 0.483981 | 19.0474 |
| 2 | 06090041 | 0.481593 | 0.00235298 | 19.0463 | 06090039 | 0.00206877 | 0.481877 | 19.0364 |
| 3 | 06090042 | 0.482517 | 0.00142899 | 18.9901 | 06090036 | 0.00000 | 0.483946 | 18.9681 |