| Red | Green | Blue | |
| z | 17.64 | ||
| znorm | Inf | ||
| sky | -Inf | -Inf | -Inf |
| S/N | 29.2 | 48.5 | 53.1 |
| S/N(c) | 0.0 | 0.0 | 0.0 |
| SN(E/C) |
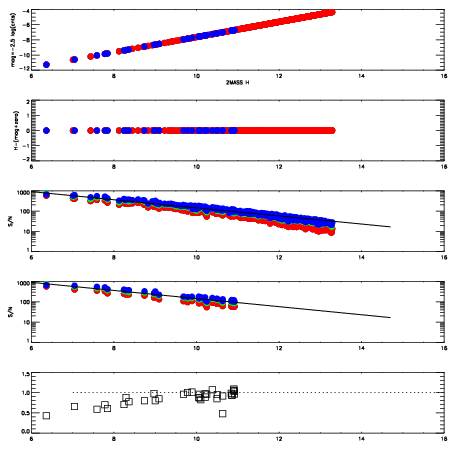
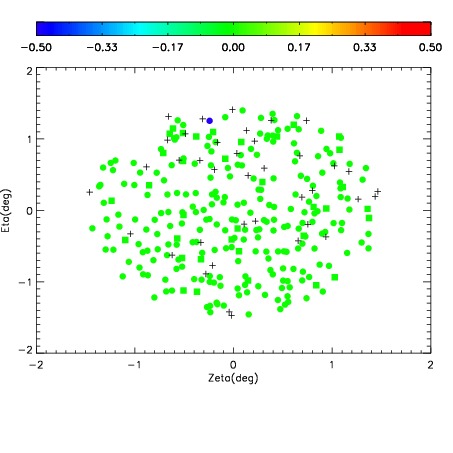
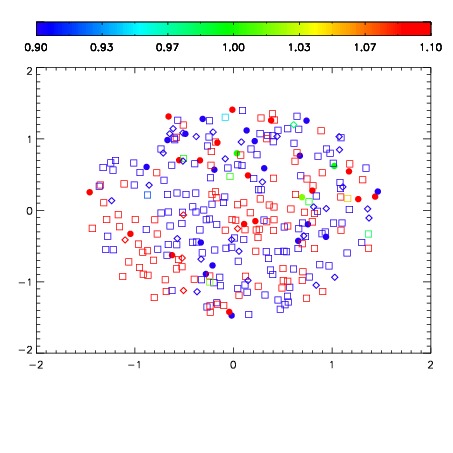
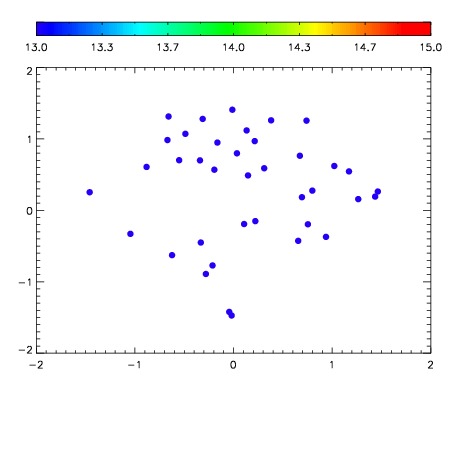

| Frame | Nreads | Zeropoints | Mag plots | Spatial mag deviation | Spatial sky 16325A emission deviations (filled: sky, open: star) | Spatial sky continuum emission | Spatial sky telluric CO2 absorption deviations (filled: H < 10) | |||||||||||||||||||||||
| 0 | 0 |
|
|
|
|
|
|
| IPAIR | NAME | SHIFT | NEWSHIFT | S/N | NAME | SHIFT | NEWSHIFT | S/N |
| 0 | 06300027 | 0.485886 | 0.00000 | 18.9573 | 06300028 | 0.00173064 | 0.484155 | 18.9410 |
| 1 | 06300026 | 0.485174 | 0.000712007 | 19.0494 | 06300025 | 0.00000 | 0.485886 | 19.0951 |
| 2 | 06300030 | 0.481597 | 0.00428900 | 19.0310 | 06300033 | -0.00137137 | 0.487257 | 18.9501 |
| 3 | 06300031 | 0.481954 | 0.00393200 | 18.8841 | 06300032 | 0.000837337 | 0.485049 | 18.9401 |
| 4 | 06300034 | 0.481213 | 0.00467300 | 18.0990 | 06300029 | -0.000412487 | 0.486299 | 18.7652 |
| 5 | 06300035 | 0.481874 | 0.00401202 | 17.7869 | 06300036 | -0.00495319 | 0.490839 | 18.3240 |