| Red | Green | Blue | |
| z | 17.64 | ||
| znorm | Inf | ||
| sky | -Inf | -Inf | -Inf |
| S/N | 30.2 | 49.2 | 53.8 |
| S/N(c) | 0.0 | 0.0 | 0.0 |
| SN(E/C) |
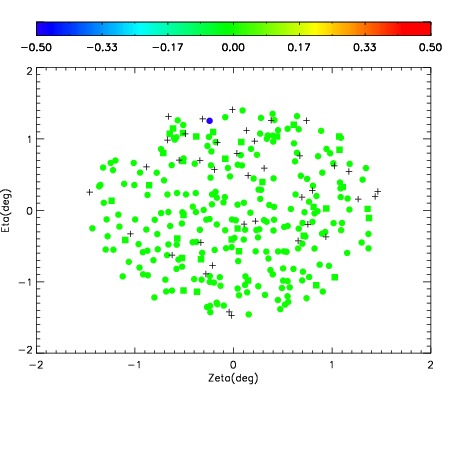
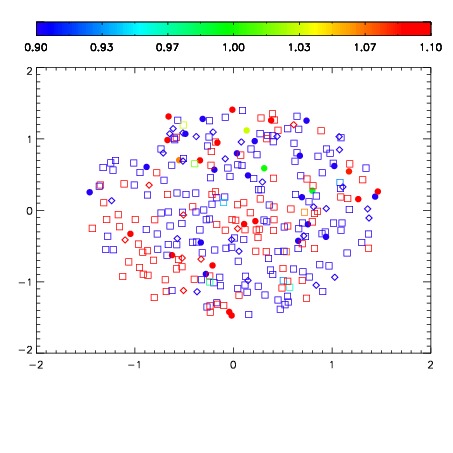
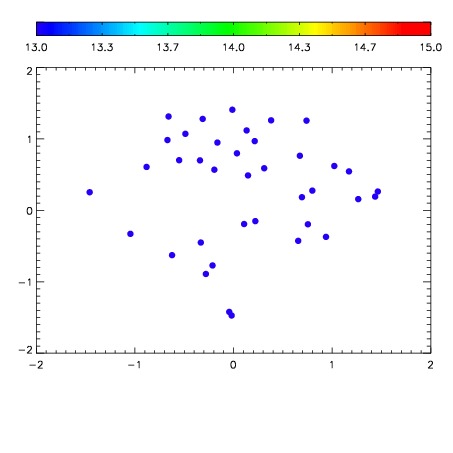

| Frame | Nreads | Zeropoints | Mag plots | Spatial mag deviation | Spatial sky 16325A emission deviations (filled: sky, open: star) | Spatial sky continuum emission | Spatial sky telluric CO2 absorption deviations (filled: H < 10) | |||||||||||||||||||||||
| 0 | 0 |
|
|
|
|
|
|
| IPAIR | NAME | SHIFT | NEWSHIFT | S/N | NAME | SHIFT | NEWSHIFT | S/N |
| 0 | 06330026 | 0.469573 | 0.00000 | 19.1175 | 06330031 | -0.00101062 | 0.470584 | 19.1608 |
| 1 | 06330029 | 0.467883 | 0.00169000 | 19.1945 | 06330024 | 0.00000 | 0.469573 | 19.1961 |
| 2 | 06330025 | 0.469312 | 0.000260979 | 19.1908 | 06330028 | -0.00170159 | 0.471275 | 19.1798 |
| 3 | 06330030 | 0.468404 | 0.00116900 | 19.1431 | 06330027 | -0.00102215 | 0.470595 | 19.1689 |