| Red | Green | Blue | |
| z | 17.64 | ||
| znorm | Inf | ||
| sky | -Inf | -Inf | -Inf |
| S/N | 20.6 | 36.4 | 38.8 |
| S/N(c) | 0.0 | 0.0 | 0.0 |
| SN(E/C) |
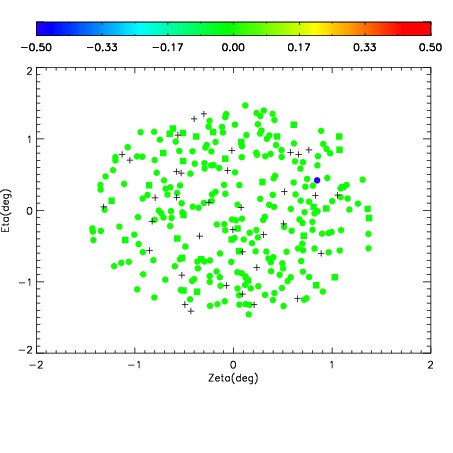
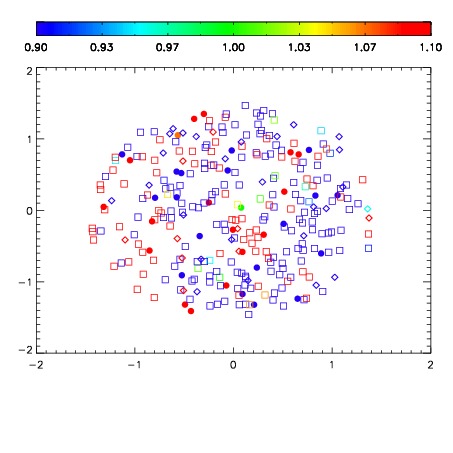
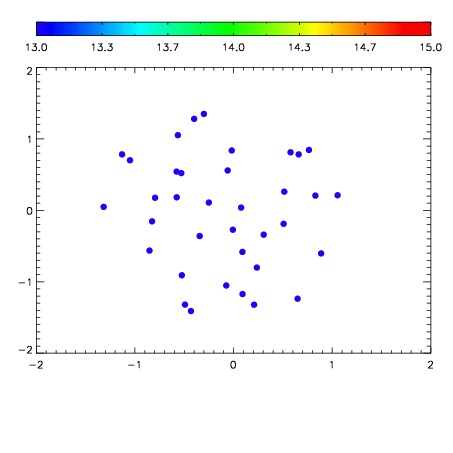

| Frame | Nreads | Zeropoints | Mag plots | Spatial mag deviation | Spatial sky 16325A emission deviations (filled: sky, open: star) | Spatial sky continuum emission | Spatial sky telluric CO2 absorption deviations (filled: H < 10) | |||||||||||||||||||||||
| 0 | 0 |
|
|
|
|
|
|
| IPAIR | NAME | SHIFT | NEWSHIFT | S/N | NAME | SHIFT | NEWSHIFT | S/N |
| 0 | 05490061 | 0.485262 | 0.00000 | 16.7961 | 05490066 | 0.00345728 | 0.481805 | 17.2175 |
| 1 | 05490060 | 0.483163 | 0.00209901 | 18.9916 | 05490059 | 0.00000 | 0.485262 | 18.9707 |
| 2 | 05490068 | 0.482560 | 0.00270200 | 18.9359 | 05490067 | 0.000239943 | 0.485022 | 18.8948 |
| 3 | 05490069 | 0.484524 | 0.000737995 | 18.4441 | 05490070 | -0.00237260 | 0.487635 | 18.8888 |